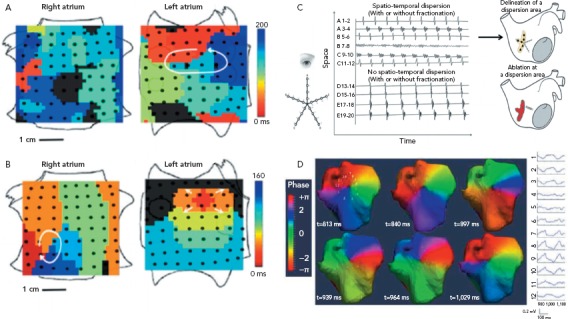
Figure 2: Mapping of Atrial Electrical Activity.

Invasive and non-invasive mapping techniques integrate multiple local and far-field electrocardiogram signals to represent wavefront propagation during AF. Analysis of these visualisations can help localise focal drivers of AF or the substrate necessary to sustain the arrhythmia. Panels A and B demonstrate simultaneous, bi-atrial activation maps created with a novel mapping system (Abbott). A: Left atrial rotor with counterclockwise activation (red to blue) with passive activation of the right atrium. B: Two focal sources present simultaneously, a counterclockwise right atrial rotor as well as a focal left atrial source showing centrifugal activation. C: Dispersion mapping using a PENTARAY™ (Biosense Webster) with both spatial and temporal dispersion indicating sites of interest. D: Epicardial phase mapping during AF generated by a noninvasive body mapping system (ECVUE, CardioInsight Technologies). Rotational activation is demonstrated in the posterior right upper atrium. Sources: Narayan et al.;[102] Seitz et al.[105] Reproduced with permission from Elsevier. Haissaguerre et al.[94] Reproduced with permission from Wolters Kluwer Health.
