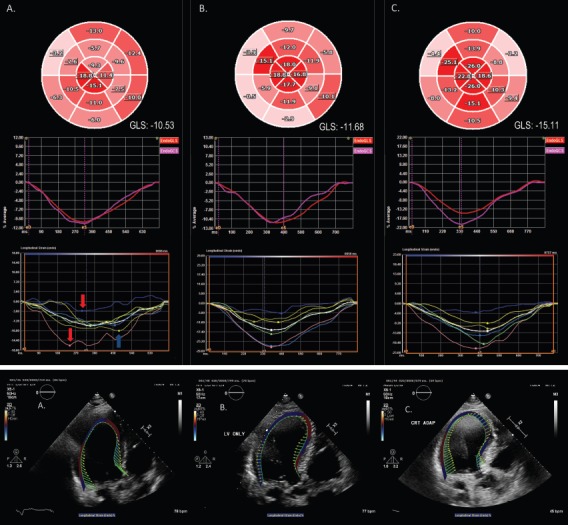
Figure 2: Optimisation of CRT with Adaptive CRT and Speckle Tracking Strain Imaging in Non-responders.

A 75-year old male CRT non-responder with an ejection fraction of 30%, left bundle branch block with QRS duration of 160 msec, and New York Heart Association Class III heart failure symptoms due to cardiac amyloidosis. (A) RV–LV=0 msec. Bull’s eye plot and endocardial GLS graph demonstrate impaired GLS (-10.53%) in an apical sparing pattern typical of cardiac amyloidosis. Segmental peak systolic strain curves illustrate a wide range in the timing of peak systolic strain, with early systolic shortening of the septum (red arrows) and late peak contraction of the lateral wall (blue arrow). (B) LV only. Note the similarly impaired GLS (-11.68%), though with time to peak strain occurring over a narrower range. (C) RV–LV=40 msec. Peak systolic deformation is markedly improved, particularly in the septal and inferior walls, with a significant increment in GLS (-15.11%). Note the narrow range of peak strain values. (D) Velocity vector tracking demonstrates severe septal–lateral wall dyssynchrony and severely impaired longitudinal strain with RV–LV=0 msec. (E) Some improvement with LV-only pacing. (F) Near-restoration of the synchrony of velocity, with convergence toward the centre of the LV, with RV–LV=40 msec. GLS = global longitudinal strain; LV = left ventricle; RV = right ventricle.
