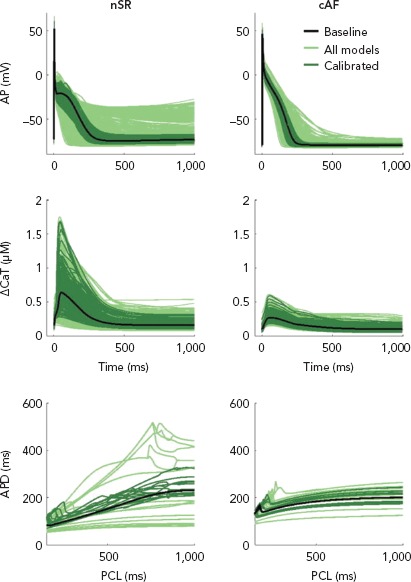
Figure 5: Simulated Normal Sinus Rhythm and Chronic AF.

Simulated normal sinus rhythm (nSR) and chronic AF (cAF) populations: steady-state action potential (AP, upper) and calcium transient amplitude (CaT, middle) traces and a few representative dynamic restitution curves (lower). AP and CaT traces and restitution curves of the nSR baseline are also shown for comparison. The x-axis in restitution curves represents pacing cycle length in ms. The populations (1,000 models each) were functionally calibrated, resulting in 213 models in the nSR population and 357 in the cAF population. AP = action potential; APD = action potential duration; cAF = chronic AF; CaT = calcium transient amplitude; PCL = pacing cycle length. Source: Vagos et al. 2017.117 Reproduced with permission from AIP Publishing.
