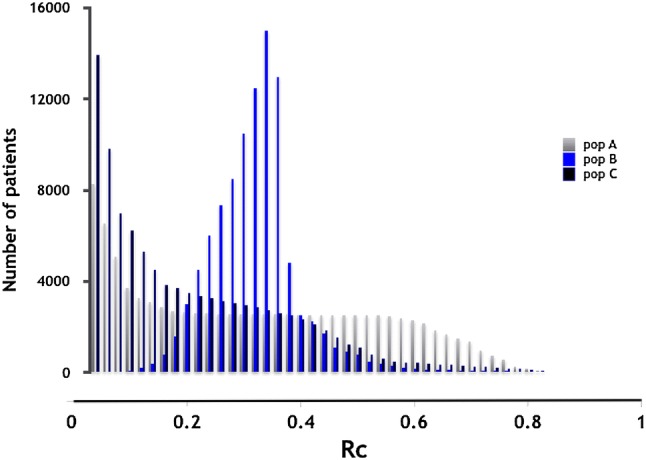
Fig. 1.

Distribution of risk without treatment (Rc) in three simulated populations, A, B and C, each comprising 100,000 individuals who were all assumed to have the same disease and, therefore, were all at risk of a clinical event but the event rates in the untreated individuals (Rc) differed in each population
