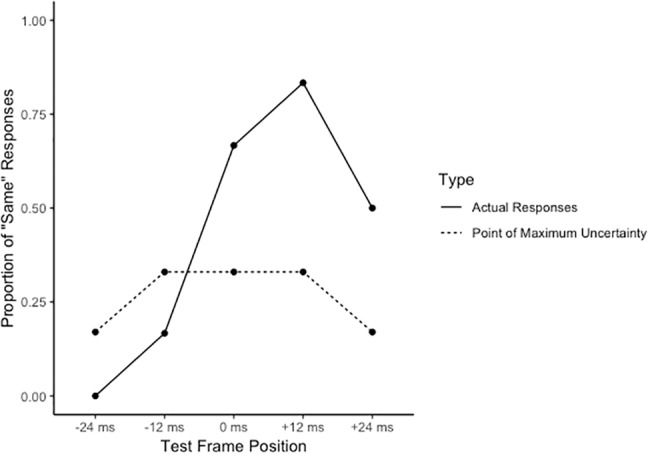
Figure 2.

A case example of the distribution of the proportion of “same” responses across each test frame position. The dashed lines represent the point of maximum uncertainty for the “same” responses at each test frame position (note the respective decrease in the point of maximum uncertainty at the two extreme test positions. This would indicate a reduced threshold for uncertainty, or an increased expectation that participants will be more certain about their response in these test frame positions).
