Fig. 2.

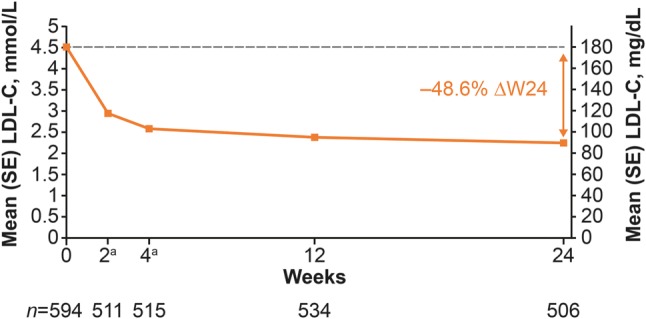
Mean (standard error [SE]) low-density lipoprotein cholesterol (LDL-C) levels over time (intention-to-treat analysis). aOptional visit. ΔW24 percent change from baseline to week 24

Mean (standard error [SE]) low-density lipoprotein cholesterol (LDL-C) levels over time (intention-to-treat analysis). aOptional visit. ΔW24 percent change from baseline to week 24