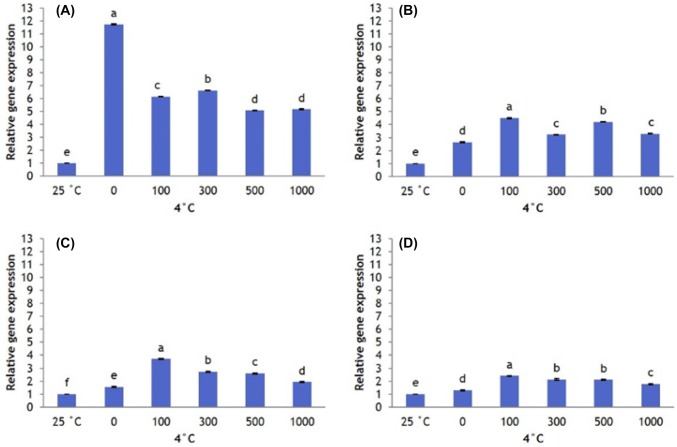
Fig. 8.
Transcript levels of SOD in leaves of Hosta capitata treated with various AFP III concentrations at 4 °C for different time intervals (a 6 h; b 12 h; c 24 h; and d 48 h). Plants at 25 °C were used as controls. Data are means of three replicates. Error bars indicate standard deviation of the means

