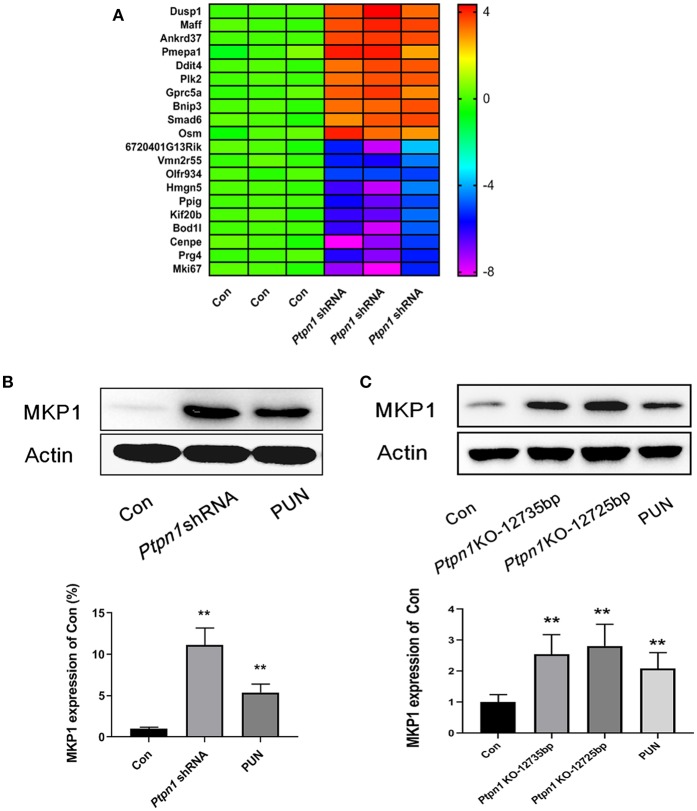
Figure 1.
Inhibition of PTP1B leads to upregulation of MKP1. (A) Assessment of the downstream genes of PTP1B by transcriptional profiling. Ptpn1 WT cells (Con) and knockdown cells were incubated for 24 h and harvested for transcriptional profiling analysis. Three independent experiments were performed and the fold changes (in log2 value) in the control group were found, which are presented in the heatmap. (B) Detection of the MKP1 expression in RAW264.7 cells. The cells of the control and Ptpn1 knockdown groups were incubated for 24 h without specific treatment. For the PUN treatment group, Ptpn1 WT cells were incubated with 20 μM PUN for 24 h. (C) Detection of the MKP1 expression in peritoneal macrophages. Peritoneal macrophages were obtained from indicated mice groups, including Ptpn1 WT and Ptpn1 knockout mice of two sequences. Ptpn1 WT cells incubated with 20 μM PUN for 24 h were represented as PUN group. Data are expressed as mean ± SD of three independent experiments. **p < 0.01 indicates statistically significant difference compared with control group.

