Figure 5.
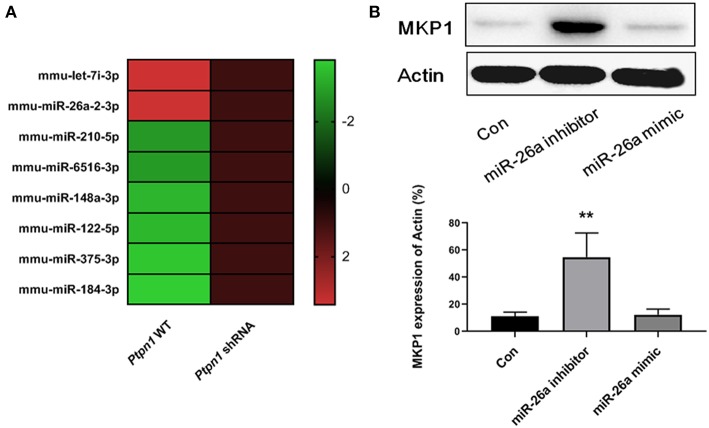
Inhibition of PTP1B promotes MKP1 via decreasing miR-26a production. (A) miRNAs expression profiles analysis. Ptpn1 WT cells and knockdown cells were incubated for 24 h and then harvested for deep-sequencing analysis. Three independent experiments were performed and fold changes (in log2 value) of control group are listed in heatmap. (B) The expression of MKP1 is regulated by miR-26a. Cells were treated by miR-26a mimic or miR-26a inhibitor for 24 h respectively, and harvested for Western blot detection. Data are expressed as mean ± SD of three independent experiments. **p < 0.01 indicates statistically significant differences as compared with the control group.

