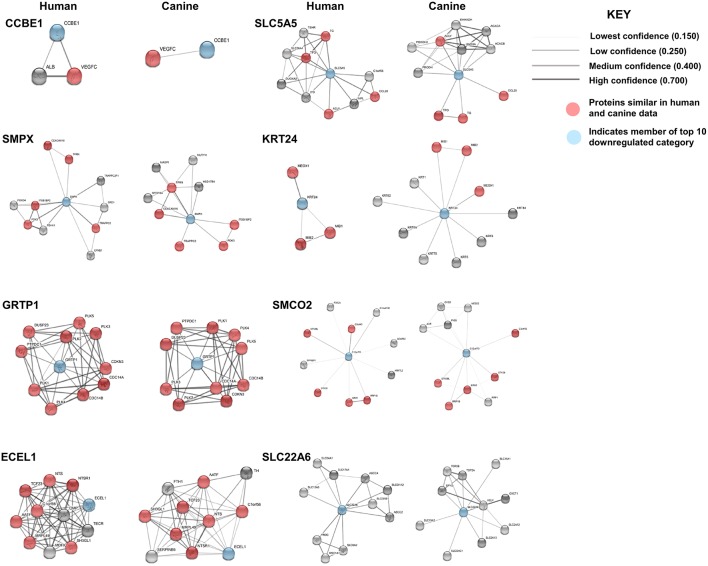
Figure 5.
Comparison of the suggested protein associations of the top 10 downregulated genes. Data was collected using the STRING database (functional protein association network version-10-5) at medium confidence (0.400). Increasing confidence is demonstrated by increased thickness and darkness of edges (intersecting lines). Red notes indicate proteins involved in similar associations in both humans and canines. Blue nodes indicate proteins that are members of the top 10 downregulated category.

