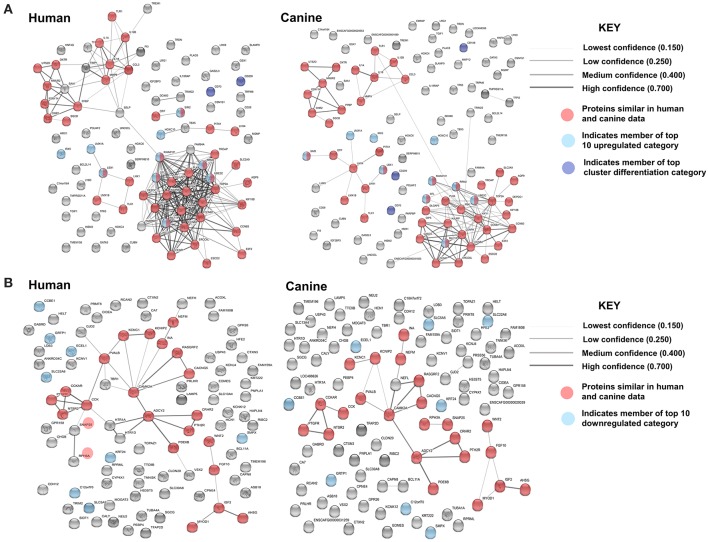
Figure 8.
Comparison of the suggested protein associations for the top 100 up- and downregulated genes in human and canine data. (A) Comparison of suggested protein associations of the protein products of the top 100 upregulated genes between humans and canines. There were 99 proteins available in the canine data and 93 proteins available in human data. Forty seven proteins were involved in similar associations between human and canine data (red nodes). Light blue nodes indicate members of the top 10 upregulated gene category. Dark blue nodes indicate members of the top 10 CD gene category. (B) Comparison of suggested protein associations of the protein products of the top 100 downregulated genes between humans and canines. There were 96 proteins available in the canine data and 90 proteins available in human data. Twenty one proteins were involved in similar associations between human and canine data (red nodes). Light blue nodes indicate members of the top 10 downregulated gene category.

