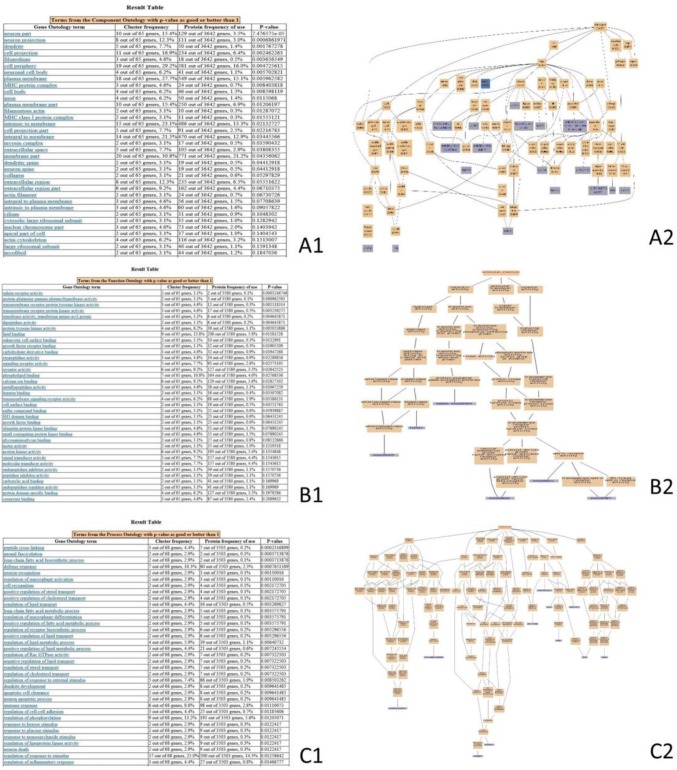
Fig. 3.
GO-enrichment analysis of the DEPs of the 30DI group compared with the 30DC group. This figure provides the screenshot of the GO-enrichment analysis. Cluster frequency indicates the ratio of the annotation of the same GO term between all of DEPs and all of proteins. (A) Gene-ontology analysis of the proteins in cellular component. A1 GO-enrichment results from the screenshot, P value < 0.05 is a significantly enriched GO entry; A2 genes annotated to the term. (B) Gene-ontology analysis of the proteins in molecular function. B1 GO-enrichment results screenshot, P value < 0.05 is a significantly enriched GO entry; B2 genes annotated to the term. (C) Gene-ontology analysis of the proteins in biological process. C1 GO-enrichment results’ screenshot, P value < 0.05 is a significantly enriched GO entry; C2 genes annotated to the term

