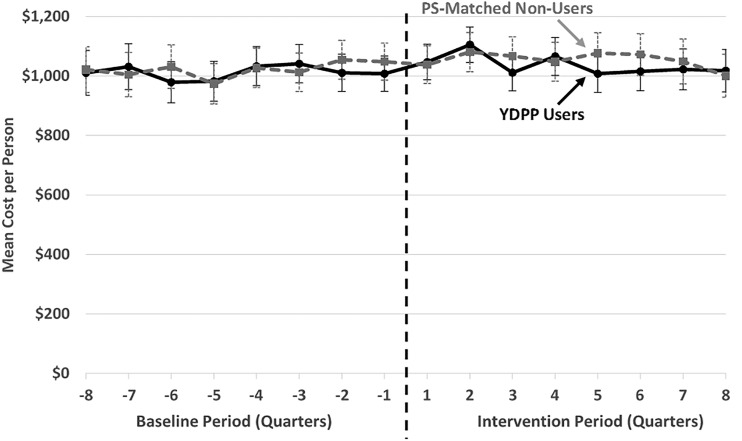
Figure 2.
Raw mean quarterly total health care expenditure trends, per commercially insured YDPP user and PS-matched nonuser. *To ensure at least 2 years of potential follow-up for all participants in the evaluation sample, we restricted the cost analysis to health plan enrollees in both groups with an index date on or before 1 June 2013; error bars reflect 95% CI for each quarterly mean.

