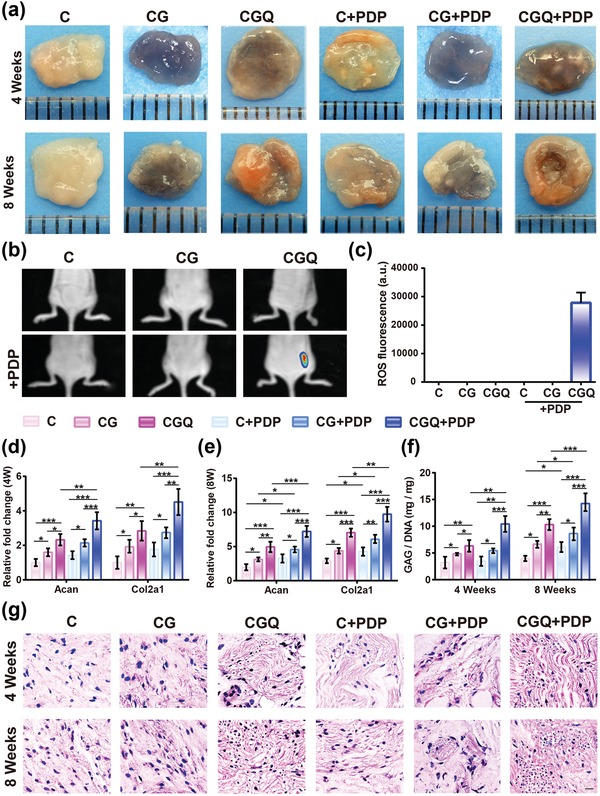
Figure 5.

In vivo evaluations on BMSCs differentiation toward chondrogenesis in the noncartilaginous environment based on the intensified stiffness and ROS production in CGQ. a) Macroscopic observation of subcutaneously implanted tissues in nude mice with or without PDP for 4 and 8 weeks. b) In vivo fluorescence imaging showing ROS generation in the mice implanted with four composites subcutaneously with or without PDP. c) The fluorescence intensity based on data from (b). d,e) Expression levels of chondrogenesis‐specific genes, i.e., Acan and Col2a1, in regenerated tissues after subcutaneous implantation in nude mice for 4 weeks (d) and 8 weeks (e). f) GAG content in regenerated tissues with subcutaneous implantation in nude mice with or without PDP for 4 and 8 weeks (normalized to the DNA content). Mean±SD, n = 6; *, ** and *** indicate p < 0.05, 0.01, and 0.001, respectively. g) Hematoxylin and eosin (HE) staining for tissues with subcutaneous implantation in nude mice with or without PDP for 4 and 8 weeks (scale bar = 40 µm). Note: C = collagen + BMSCs, CG = collagen crosslinked with genipin + BMSCs, CGQ = collagen crosslinked with genipin and QDs + BMSCs, C + PDP = collagen + BMSCs + irradiation with an 808 nm laser at fluence of 3 J cm−2 for 3 min, CG + PDP = CG scaffold + BMSCs + irradiation with an 808 nm laser at fluence of 3 J cm−2 for 3 min, CGQ + PDP = CGQ scaffold + BMSCs + irradiation with an 808 nm laser at fluence of 3 J cm−2 for 3 min.
