Figure 2.

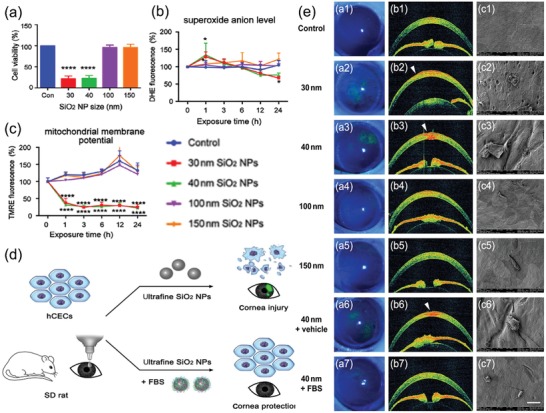
a) Effect of SiO2 NPs on cell viability for range of diameters and concentrations. Mean cell viability of hCECs, measured by CCK8 with a microplate reader following treatment with SiO2 NPs of diameters 30, 40, 100, and 150 nm, at 100 µg mL−1, for 24 h. n = 3 per bar; error bars, standard deviation (SD); ****P < 0.0001 by one‐way ANOVA and Tukey's post hoc test. b,c) Damage to hCECs exposed to SiO2 NPs with varying size. b) Mean intracellular O2 ●−, as measured by dihydroethidium (DHE) fluorescence of hCECs exposed to 100 µg mL−1 SiO2 NPs of different diameters between 0 and 24 h. c) Mean mitochondrial membrane potential, as measured by TMRE fluorescence of hCECs exposed to 100 µg mL−1 SiO2 NPs of different diameters for 0–24 h. n = 3 per bar; error bars show SD; *P < 0.05, ****P < 0.0001, compared with control. d) Scheme of toxicity of silicon dioxide nanoparticles on the cornea and protein corona as a strategy for therapy. e) Structural corneal damage caused by exposure to SiO2 NPs with varying size and therapeutic effect of FBS. a1–a5) Representative images of corneal fluorescein staining under cobalt blue light following exposure to distilled water, and 30, 40, 100 and 150 nm SiO2 NPs, respectively. Corneal damage is revealed by green fluorescence. b1–b5) Representative AS‐OCT images following exposure to the same agents in (a1–a5). White arrowheads indicate corneal defects. c1–c5) Representative SEM images following exposure to the same agents as in (a1–a5). Scale bar, 400 mm. Representative images of corneal fluorescein staining (a6, a7), AS‐OCT (b6, b7), and SEM (c6, c7) for cornea treated with vehicle or FBS after 40 nm SiO2 NPs, respectively. Reproduced with permission.50 Copyright 2018, Elsevier.
