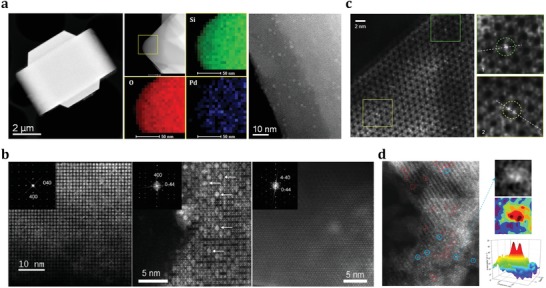
Figure 5.

a) HAADF‐STEM image, selected‐area element mapping analyses, and high‐resolution HAADF‐STEM image of Pd@MFI sample. Adapted with permission.46 Copyright 2018, American Chemical Society. b) Aberration‐corrected STEM‐HAADF micrographs of dehydrated Ag@LTA recorded along [001], [011], and [111] directions. Adapted with permission.87 Copyright 2011, Wiley‐VCH. c) Aberration‐corrected HAADF‐STEM image of Pt@MWW, where two zoom‐in are shown in the square regions. Adapted with permission.54 Copyright 2017, Nature Publishing Group. d) Aberration‐corrected HAADF‐STEM images characterizing Rh@FAU with intensity surface plot and 3D intensity surface plot. Adapted with permission.88 Copyright 2016, American Chemical Society.
