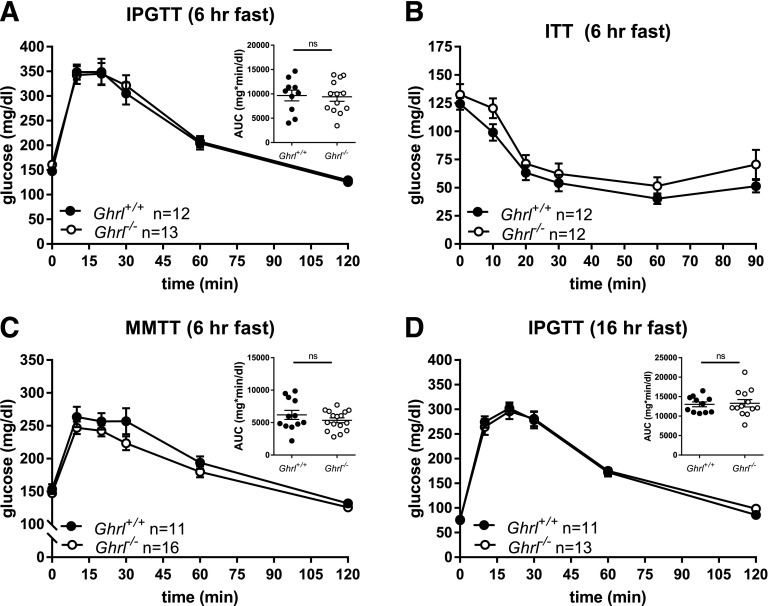
Figure 3.
Glucose tolerance in Ghrl+/+ and Ghrl−/− male mice. A: IPGTT (1.5 g/kg body wt) following 6-h fast and glucose AUC. B: ITT (0.5 units/kg body wt). C: MMTT (200 μL; Ensure) and glucose AUC. D: IPGTT (1.5 g/kg body wt) following 16-h fast and glucose AUC. Glucose concentrations are shown as mean ± SEM, and glucose AUCs are shown as mean ± SEM with each symbol representing an individual animal. A and D: Unpaired t test for all comparisons. C: Welch test. hr, hour; ns, not significant.

