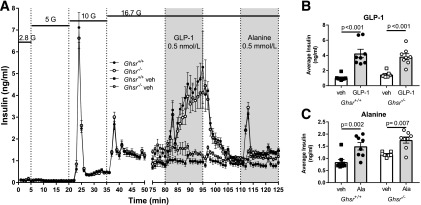
Figure 6.
Insulin secretion from perifused islets isolated from Ghsr+/+ and Ghsr−/−. A: Insulin was measured in perifusate from islets exposed to stepwise increases (2.8, 5, 10, and 16.7 mmol/L) in glucose (G). From 80 to 95 min, islets were exposed to 0.5 nmol/L GLP-1 or vehicle, and from 110 to 125 min, islets were exposed to 0.5 mmol/L alanine or vehicle. Insulin concentrations are shown as mean ± SEM. B and C: Average insulin concentrations during GLP-1 (B) and alanine (C) were greater than vehicle controls for Ghsr+/+ and Ghsr−/− islets. Mean ± SEM during specific treatments. One-way ANOVA with Sidak post hoc test; P values are indicated between significant comparisons. Ala, alanine; veh, vehicle.

