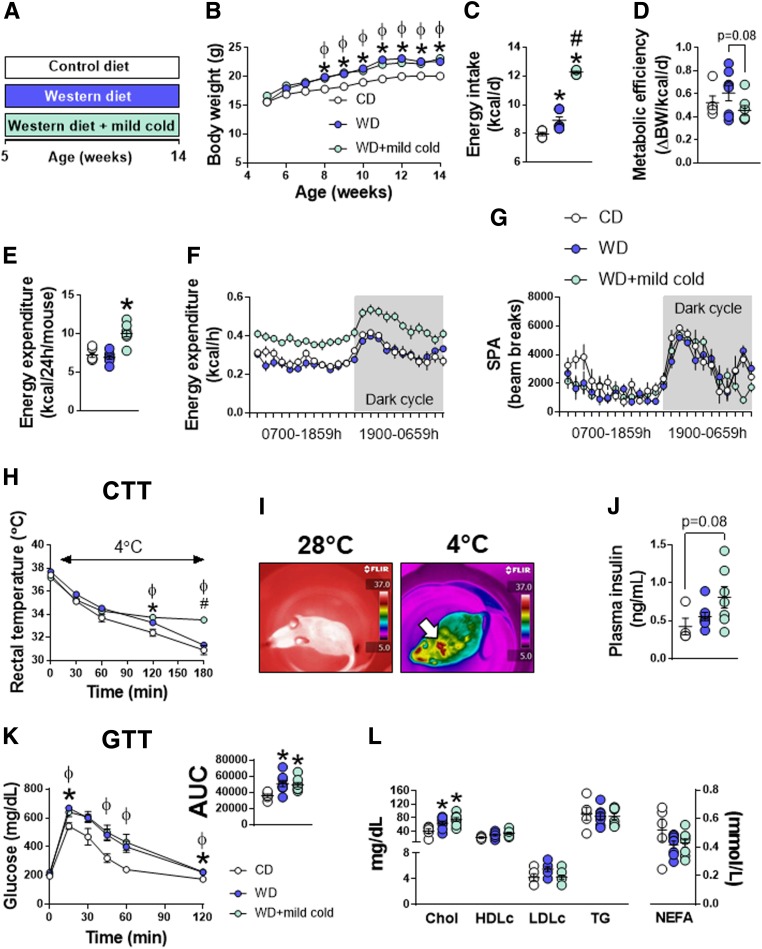
Figure 1.
Effects of mild cold exposure on energy homeostasis and glucose tolerance. A: 5-week-old female mice were randomized to either a CD or WD at thermoneutrality (28°C) for 9 weeks. A third group of animals consumed a WD while housed under mild cold stress conditions (20°C) for 9 weeks. B: Weekly body weights (n = 5–8/group). C and D: Energy intake and metabolic efficiency (i.e., change in body weight over time per energy consumed) (n = 5–8/group). E: Average total EE (n = 5–8/group). F and G: Mean 24-h EE and spontaneous physical activity (SPA) curves (n = 5–8/group). H: Acute CTT. Baseline rectal temperature measurements were recorded in home cages (28°C or 20°C). Thereafter, mice were placed in environmental cold chambers (4°C) and rectal temperature measurements were taken every 30 min for 180 min (n = 5–8/group). I: Representative real-time thermal images captured during the CTT. Identical camera settings were used in ambient (home-cage temperature) and cold (4°C) environments. J: Plasma insulin concentrations (n = 5–8/group). K: GTT (n = 5–8/group). GTTs were performed at the same environmental temperature at which mice were housed. L: Plasma cholesterol and lipid concentrations (n = 5–8/group). Data are mean ± SE. *P < 0.05 vs. CD; #P < 0.05 vs. WD; ɸP < 0.05 CD vs. WD + mild cold. Chol, total cholesterol; d, day; HDLc, HDL cholesterol; LDLc, LDL cholesterol; NEFA, nonesterified fatty acid.

