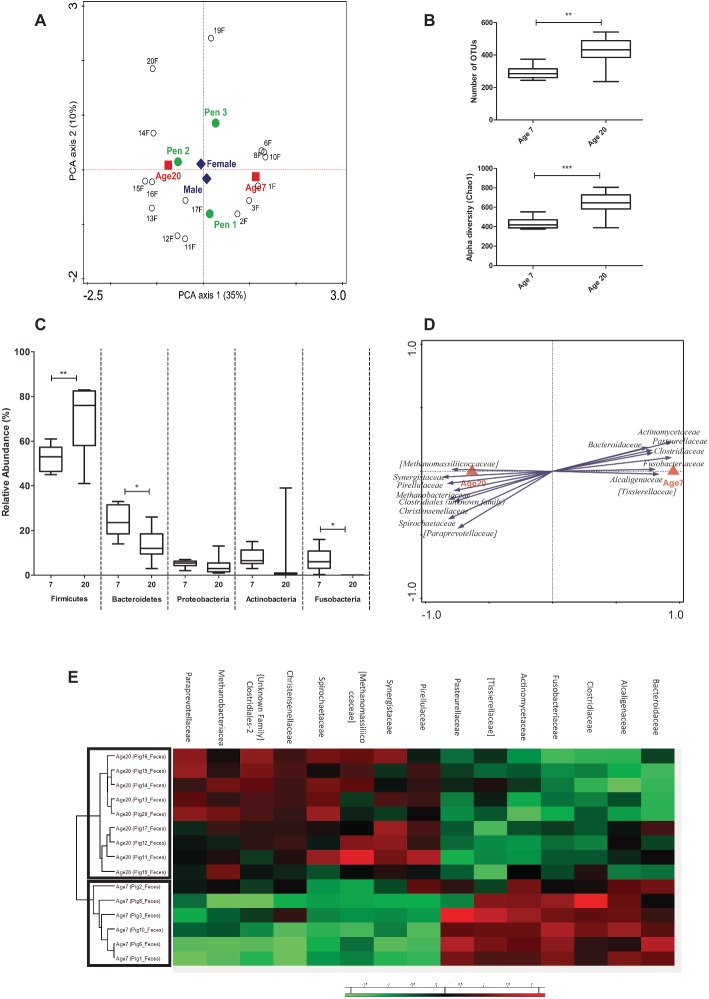
Figure 2.
Microbial composition and explanatory variables of fecal samples. (A) Principal Component Analysis (PCA) plot showing variation in terms of explanatory variables in the data. Testing single variables by Weighted UniFrac PERMANOVA supports clear separation by age (p < 0.001) and pen (p = 0.013) but not by gender (p = 0.948). (B) Alpha diversity (Number of OTUs and Chao1 bias corrected) showing increased diversity at 20 compared to 7 days of age. (C) Relative abundance of five phyla (with highest relative abundance) at two ages in fecal samples (Mann Whitney test). (D) Partial redundancy analysis (pRDA) for the explanatory variable age (corrected for pen) at family level (RD1 = 40.23% and RD2 = 11.36%). (E) Heat map showing relative abundance of 15 most discriminative bacterial families for age. *p < 0.05, **p < 0.01, ***p < 0.001.

