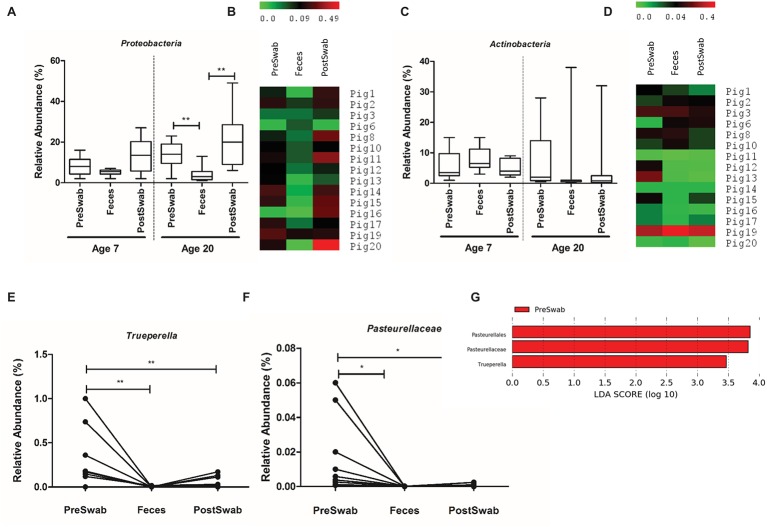
Figure 7.
Microbial community composition of sample types. (A,C) Relative abundance of Proteobacteria and Actinobacteria at day 7 and day 20. (B,D) Heat map of relative abundance of Proteobacteria and Actinobacteria at day 20 of all animals. (E,F) Relative abundance of the Trueperella genus and Pasteurellaceae family at day 20 among sample types. (G) LEfSe analysis identified Trueperella genus and Pasteurellaceae family as the only differentially abundant taxa among sample types (*p < 0.05, **p < 0.01).

