Figure 8.

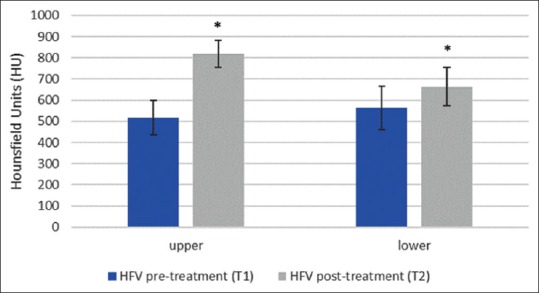
Graph showing the average pre-and post-treatment bone density changes in HU value in the HFV group. (*= statistically significant P < 0.05)

Graph showing the average pre-and post-treatment bone density changes in HU value in the HFV group. (*= statistically significant P < 0.05)