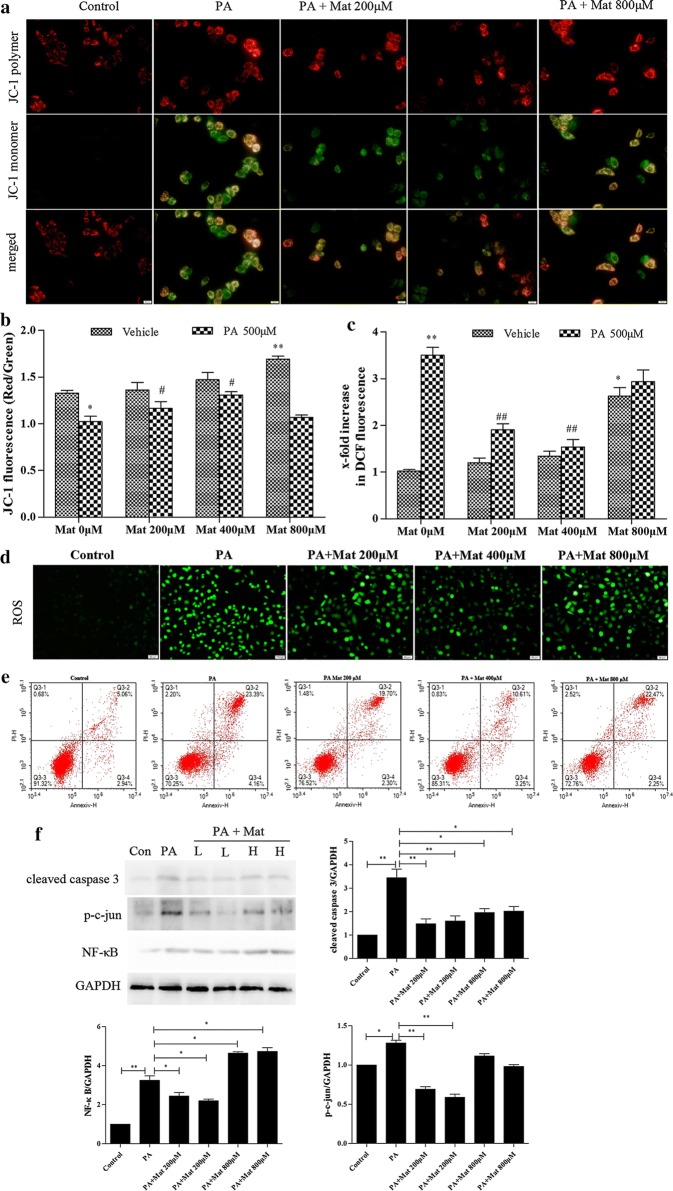
Fig. 5.
Effect of Mat on mitochondrial activation, ROS production and apoptosis in PA-induced L02 cells. The L02 cells were treated with PA (500 μM), Mat (200, 400, 800 μM) or the combination of PA (500 μM) and Mat (200, 400, 800 μM) for 12 h. a Mitochondrial membrane potential (MMP) imaging (×400). b JC-1 fluorescence and c DCF fluorescence detected by fluorescence spectrophotometer. *P < 0.05 and **P < 0.01 vs. Control, #P < 0.05 and ##P < 0.01 vs. PA. d ROS imaging (×400). e apoptosis analyzed by flow cytometry. f Expression of cleaved caspase 3, p–c-jun and NF-κB in L02 cells. *P < 0.05 and **P < 0.01

