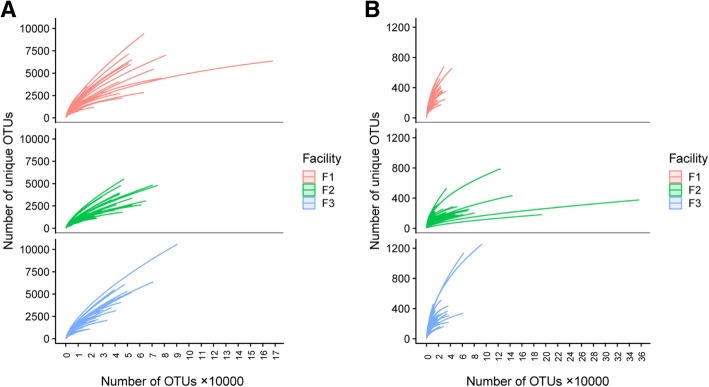
Fig. 3.
Rarefaction curves for 16S rRNA V4 (a) and ITS2 (b) sequences. Individual samples were plotted using the number of OTUs that represent the sequence sample size on x axis and the number of unique OTUs that indicate the species richness on y axis. Each curve is color-coded based on the facility in which the sample was collected

