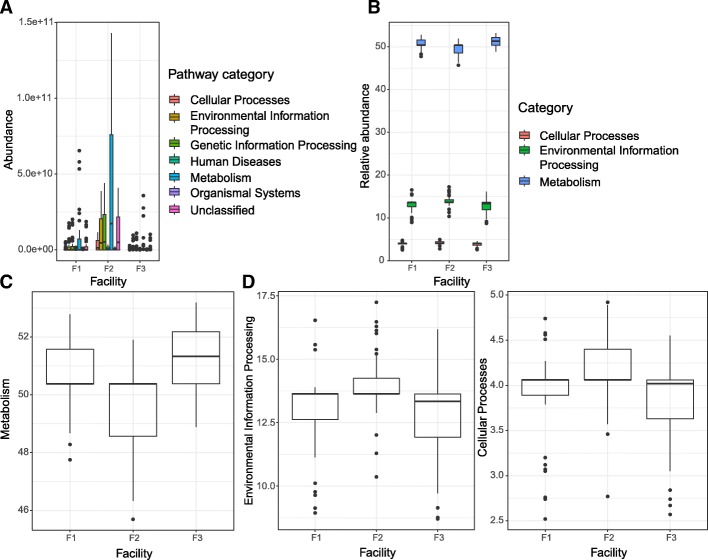
Fig. 9.
Predicted functional profiles of microbiota in facilities F1, F2, and F3 derived from PICRUSt inference based on tier 1 KEGG ortholog categories (KO). Absolute abundance of tier 1 functional categories by facility is shown in a panel (a). Relative abundance of selected tier 1 functional categories by facility is shown in a panel (b). Relative abundance of predicted metabolism of microbiota by facility is shown in a panel (c). Relative abundance of Environmental information processing functional category in microbiota from three facilities is shown in a panel (d). Relative abundance of Cellular processes functional category in microbiota from three facilities is shown in a panel (e)

