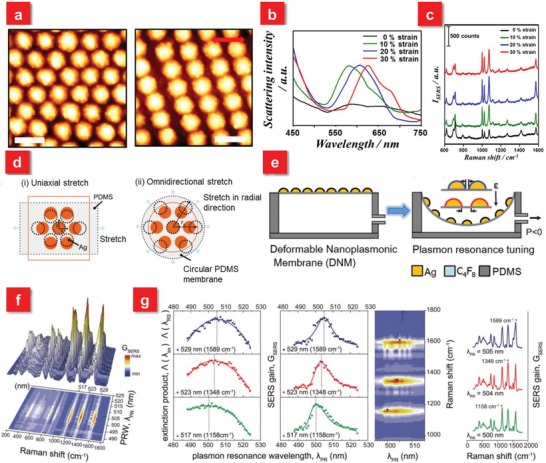
Figure 2.

a) AFM images of the plasmonic cap arrays under applied strains of 0 (left) and 30% (right). The red double sided arrow denotes the strain direction. Scale bar: 500 nm. b) Scattering spectra of the plasmonic cap arrays at different applied strains. c) Tunable SERS spectra of the 1 × 10⁻⁶ m benzenethiol‐adsorbed plasmonic cap arrays as a function of the applied strain. Reproduced with permission.101 Copyright 2013, American Chemical Society. d) Schematic illustration of interstitial gap modulation for i) uniaxial stretching and ii) omnidirectional stretching. e) Deformable nanoplasmonic membranes (DNMs) to allow large extensibility for continuously increasing the gap distance between neighboring nanoislands in tuning plasmon resonance. f) A quantitative investigation of plasmon resonance and individual SERS peaks. g) The analytic correlation between plasmon resonance and individual SERS peaks. The individual SERS peak has the maximum gain at a specific plasmon resonance wavelength, which has the maximum extinction product of an excitation and the corresponding Raman scattering wavelengths (left). Consequently, the relative SERS peak heights substantially vary depending on the plasmon resonance of SERS probes (right). Reproduced with permission.75 Copyright 2014, John Wiley & Sons.
