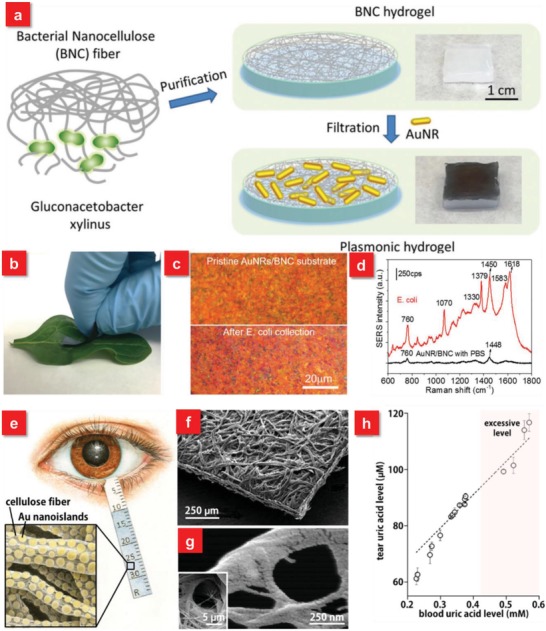
Figure 4.

a) Schematic illustration showing the steps involved in the preparation of plasmonic hydrogel from bacterial nanocellulose and photographs showing BNC hydrogel and plasmonic BNC hydrogel. b) Photograph showing a plasmonic BNC SERS substrate being swabbed on a spinach leaf surface intentionally contaminated with E. coli. c) Bright field optical images of pristine AuNRs/BNC paper and E. coli adsorbed on AuNRs/BNC paper collected by swabbing. d) Representative SERS spectra collected from E. coli adsorbed on the AuNRs/BNC swab showing characteristic Raman bands of E. coli. Reproduced with permission.128 Copyright 2016, John Wiley & Sons. e) Schematic diagram of a plasmonic Schirmer strip for SERS‐based tear screening. f) A plasmonic Schirmer strip and g) cellulose nanofibers covered with Au nanoislands in Volmer−Weber mode. h) Correlation between uric acid level in tears and in blood. Reproduced with permission.65 Copyright 2016, American Chemical Society.
