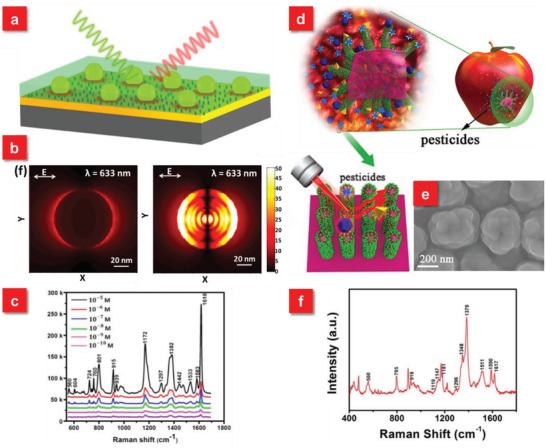
Figure 6.

a) Schematic illustration of particle‐on‐film configuration for SERS detection. b) E‐field profiles in the XY plane of single Au nanoparticle on SiO2 substrate (left) and particle‐on‐film configuration (right). c) Detection limit measurements of crystal violet molecules by the particle‐on‐film substrates. Reproduced with permission.142 Copyright 2017, American Chemical Society. d) Schematic illustration of the high‐performance G‐SERS substrate via a “press and peel‐off” approach. e) SEM image of the G‐SERS substrate after depositing with Ag. f) SERS spectra of multiple components of pesticide residues (TMTD, MG, MPT) on cucumber peels using the G‐SERS substrate. Reproduced with permission.44 Copyright 2017, American Chemical Society.
