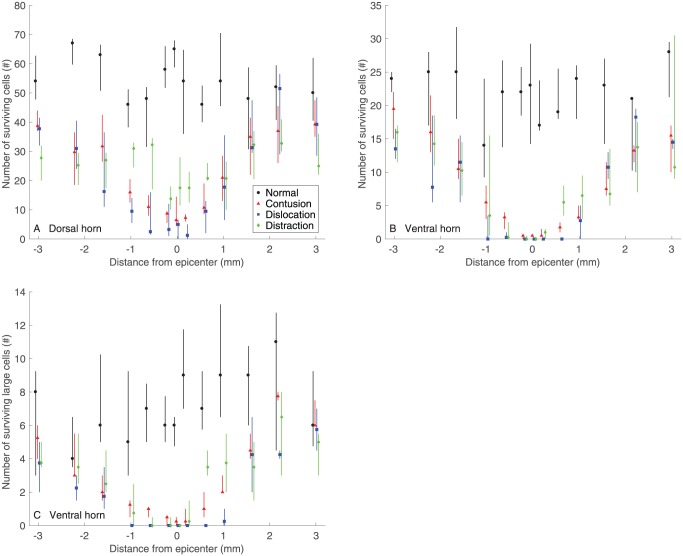
Figure 4.
(A) Number of surviving cells in the dorsal horn, (B) number of surviving cells in the ventral horn (B), and (C) number of surviving large cells in the ventral horn for the different SCI mechanisms (n = 6) and the control (n = 5). Data are presented as median with quartiles and offset horizontally for clarity. The position along the spinal cord extended from −3 mm (rostral) through +3 mm (caudal) to the epicenter (0 mm). Statistical differences (P < .05) in (A) are as follows: (1) differences from Normal: contusion −2.2, –1.6, –1, –0.6, –0.2, 0, +0.2, +0.6, +1 mm; distraction −3.2, –1.6, –1, –0.6, –0.2, 0, 0.2, 0.6, 1 mm; distraction −3, –2.2, –1.6, –1, –0.2, 0, +0.2, +0.6, +1, +2.2, +3 mm; (2) differences between contusion and dislocation: none; (3) differences between contusion and distraction: –3, –0.6, 0, +0.2, +0.6 mm; (4) differences between dislocation and distraction: –1, –0.6, 0, +0.2, +0.6, +3 mm. Statistical differences (P < .05) in (B) are as follows: (1) differences from Normal: contusion −1.6, –1, –0.6, –0.2, 0, +0.2, +0.6, +1, +1.6, +3 mm; distraction −3, –2.2, –1.6, –1, –0.6, –0.2, 0, +0.2, +0.6, +1, +1.6, +3 mm; distraction −3, –1.6, –0.6, –0.2, 0, +0.2, +0.6, +1, +1.6 mm; (2) differences between contusion and dislocation: –0.2, 0, +0.2 mm; (3) differences between contusion and distraction: 0, +0.6 mm; (4) differences between dislocation and distraction: +0.2, +0.6 mm. Statistical differences (P < .05) in (C) are as follows: (1) differences from normal: contusion −1.6, –1, –0.6, –0.2, 0, +0.2, +0.6, +1 mm; distraction −3.2, –1.6, –1, –0.6, –0.2, 0, +0.2, +0.6, +1, +1.6 mm; contusion −1.6, –1, –0.6, –0.2, 0, +0.2, +0.6, +1.6 mm; (2) differences between contusion and dislocation: –1, –0.6, –0.2, 0, +0.2, +0.6, +1, +2.2 mm; (3) differences between contusion and distraction: +0.6 mm; and (4) differences between dislocation and distraction: +0.2, +0.6, and +1 mm. SCI indicates spinal cord injury.

