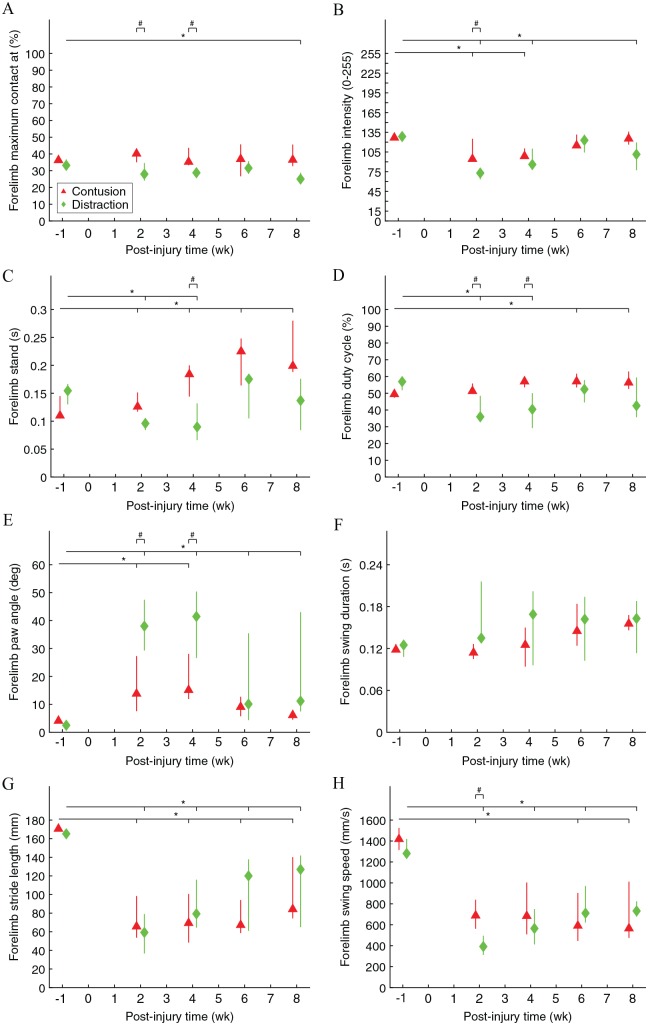
Figure 4.
Front paw movements during walking on the walkway. “Forelimb maximum contact at” was the average percent time that a front paw spent to achieve maximum contact area with the floor during a stance phase (A). Forelimb intensity was the average brightness that a front paw generated in the system as it achieved maximum contact area with the floor (B). Forelimb stand was the average standing time of a front paw during a stance phase (C). Forelimb duty cycle was the average percent time that a front paw spent on the stance phase in a step cycle (D). Forelimb paw angle was the average rotated angle with respect to the parallel orientation of a front paw at initial contact and lift-off (E). Forelimb swing duration was the average travel time of a front paw during a swing phase (F). Forelimb stride length was the average travel distance of a front paw during a swing phase (G). Forelimb swing speed was the average travel speed of a front paw during a swing phase (H). Data are presented as median with quartiles and offset horizontally for clarity.
*Significantly different from normal (P < .05); #significantly different between injury types (P < .05).

