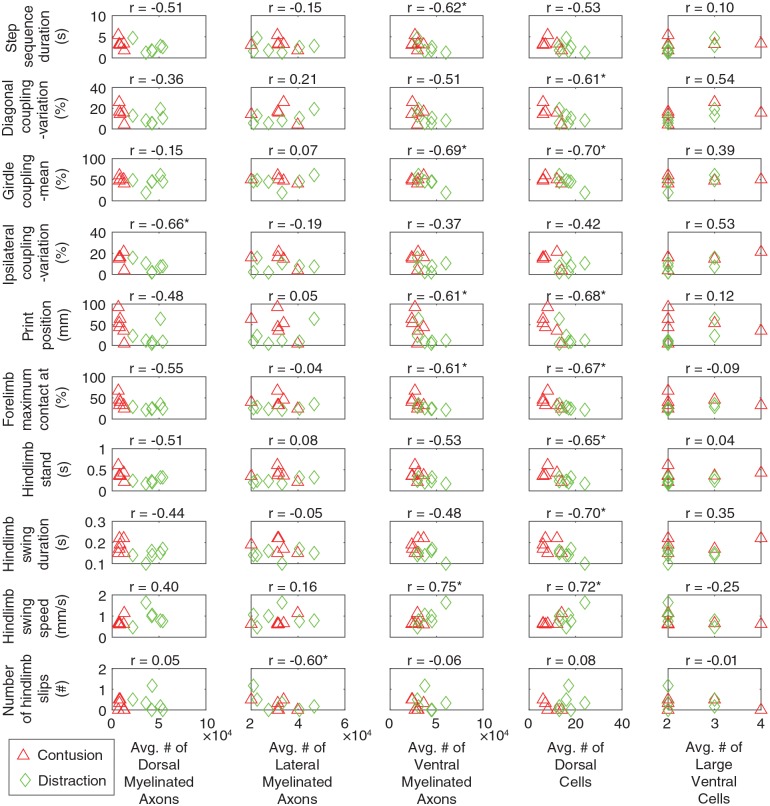
Figure 8.
Scatterplots showing the relation between the behavioral and histological parameters evaluated by Pearson correlation coefficient. The behavioral parameters were obtained at 8 weeks after the SCIs. Only the behavioral parameters that were significantly correlated with at least one of the histological parameters are shown. In other words, the other behavioral parameters in Figures 1 and 3 to 6 that are not listed here had no strong correlation with any of the histological parameters. The histological parameters have been published previously.19 The average numbers of dorsal, lateral, and ventral myelinated axons were the average values between 5 mm rostral and caudal in the various white matter regions. The average numbers of dorsal and large ventral cells were the average values, respectively, between 1.0 mm rostral and 0.6 mm caudal and between 2.2 mm rostral and 1.6 mm caudal to the epicenter in the horn areas. These ranges to the epicenter were where histological differences existed across the SCI mechanisms. SCI indicates spinal cord injury.
*Significantly correlated (P < .05).

