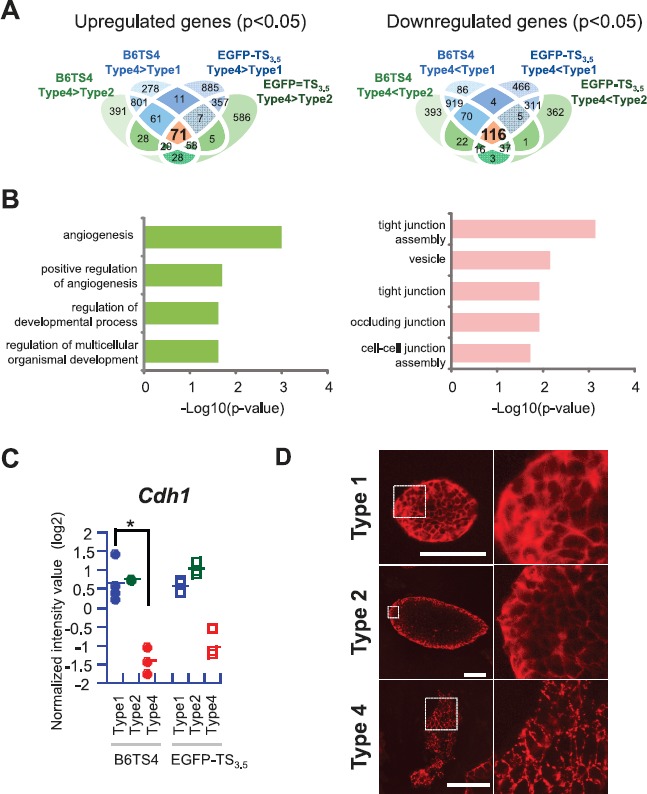
Fig. 7.

Extraction of differentially expressed genes (DEGs) between type 4 and types 1 and 2 colonies and their GO analysis. A) A Venn diagram showing the overlaps of DEGs in two TSC lines. In these lines, 71 commonly upregulated and 116 commonly downregulated genes were identified. B) The GO analyses showing functional annotation of the overlapping genes extracted in the Venn diagram. C) Expression levels of Cdh1 showing lower expressions in type 4 colonies in both lines, although there was no statistical significance for the ICR line. *P < 0.05. D) Immunofluorescence staining for CDH1. Types 1 and 2 colonies showed intense meshwork patterns, whereas type 4 showed a patchy staining pattern. Bars = 100 μm.
