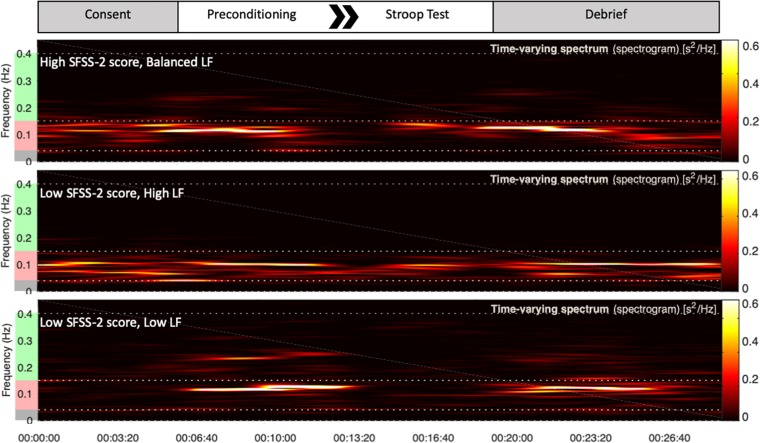
FIGURE 1.
Top portion of the figure is a schematic of each study session. Underneath are representative examples of HRV frequency domain measures during the session for three different subjects. Increased power in the green frequency band represents parasympathetic HF response. Increased power in the red frequency band represents sympathetic LF response. During the Stroop test, the top subject exhibited high flow with a balanced LF response. The bottom two subjects, at extremes of either high or low sympathetic response, reported low flow.

