
Fig. 6.
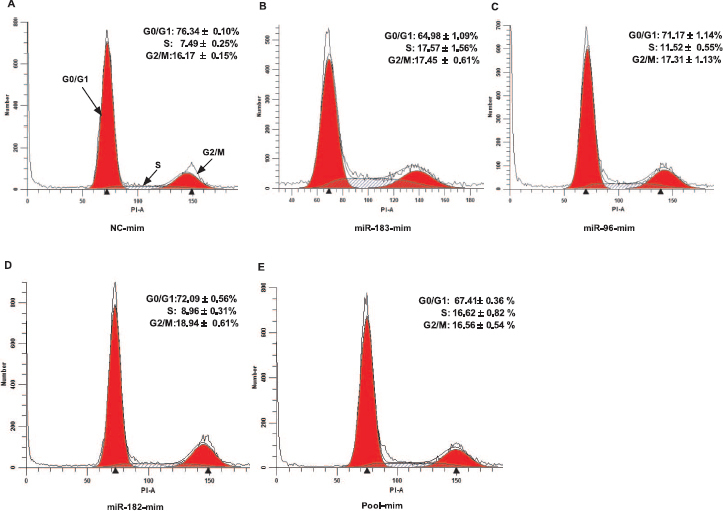
Overexpression of miR-183-96-182 cluster changes the cell cycle profile of granulosa cells. Representative histograms of flow cytometric analysis of granulosa cells transfected with miRNA mimic negative control (A), miR-183 mimics (B), miR-96 mimic (C), miR-182 mimic (D), and pooled mimics (E). The analyzed cell counts are indicated on the Y-axis, and the DNA content of cells detected by PI staining is indicated on the X-axis. Data are mean ± SEM of n = 3.