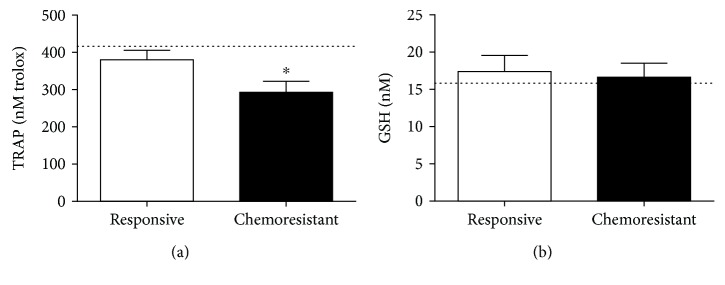
Figure 5.
Antioxidant profiling of plasma samples from responsive and chemoresistant patients. The total radical antioxidant parameter (TRAP, (a)) and reduced glutathione (GSH, (b)) levels were measured to determine the antioxidant profile of both groups. ∗ indicates a significant difference (p < 0.05). The line illustrates the mean levels of each parameter as determined in healthy controls.

