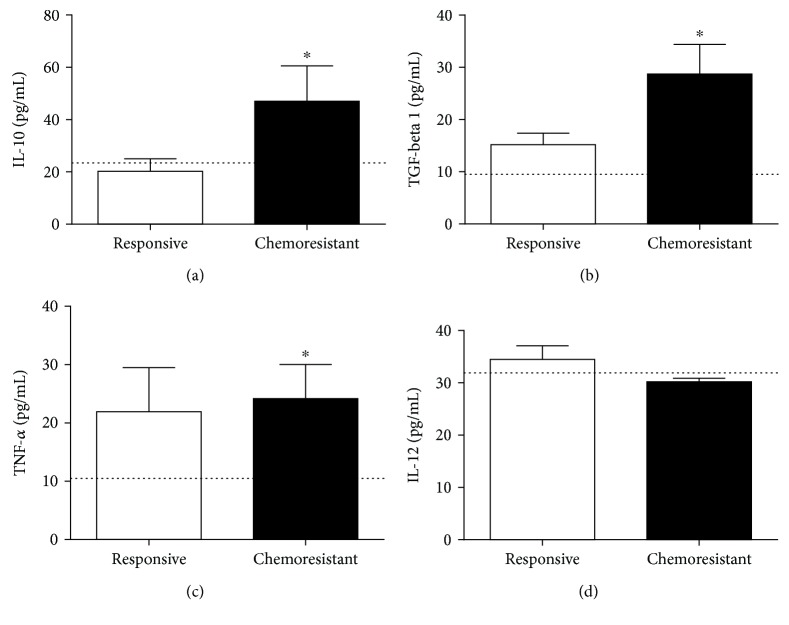
Figure 6.
Cytokine profiling. The circulating levels of IL-10 (a), TGF-β1 (b), TNF-α (c), and IL-12 (d) were evaluated in both the responsive and resistant groups. ∗ indicates statistical significance (p < 0.05). The line illustrates the mean levels of each parameter as determined in healthy controls.

