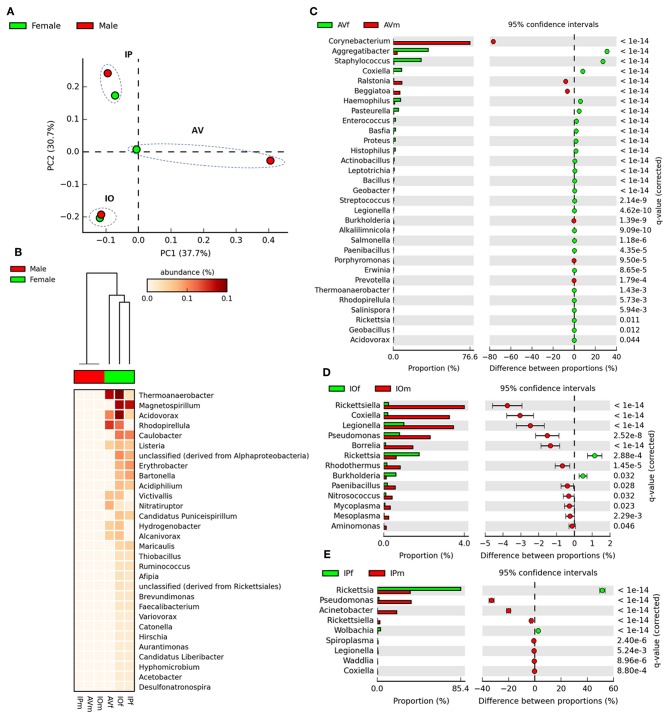
Figure 2.
Comparison of taxonomical profiles in the gut microbiota of AVf, AVm, IPf, IPm, IOf, and IOm. (A) First axis PCA plot showing the variance of taxonomical profile at level of genera between samples according to tick species and sex, arbitrary ellipses (dashed lines) were drawn to facilitate the interpretation of the figure. (B) Heatmap plot showing differences in relative abundance of bacterial genera's in tick gut microbiota between sex. The differences in the abundance of bacterial genera between gut microbiomes from male and female ticks are shown in extended error bars plot for AV (C), IP (D), and IO (E). Only genera with significantly different abundances between males and females are shown (q < 0.05).

