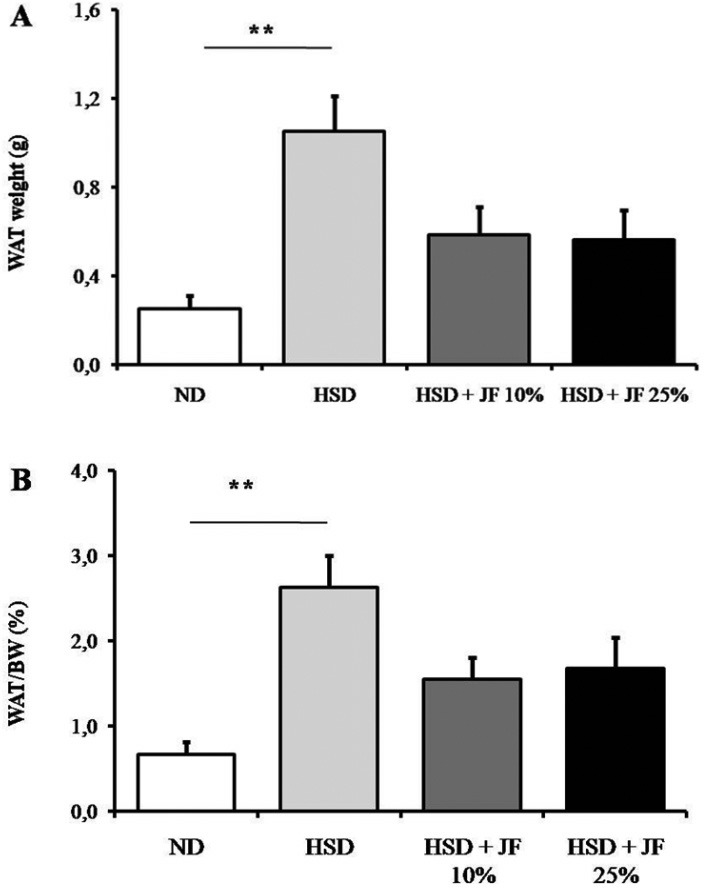
Figure 4. JF blunted the epididymal WAT increase in HSD-fed mice. (A) WAT weight measured after 8 weeks of treatments. (B) The proportion of WAT to body weight presented in %. ND (as control), HSD, JF. **p < 0.01 by ANOVA and subsequent Bonferroni post-hoc test. Bars represent mean ± SE. n = 5 for each group.

