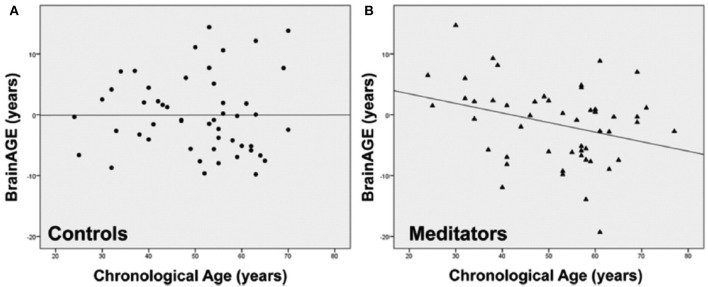
Figure 10.
Group-specific links between age-related measures. Scatterplots and regression lines were generated separately for (A) controls (circles) and (B) meditation practitioners (triangles). The x-axes display the chronological age; the y-axes display the BrainAGE index (negative values indicate that participants' brains were estimated as younger than their chronological age, positive values indicate that participants' brains were estimated as older). [Figures and legend reproduced from Luders et al. (43), with permission from Elsevier].

