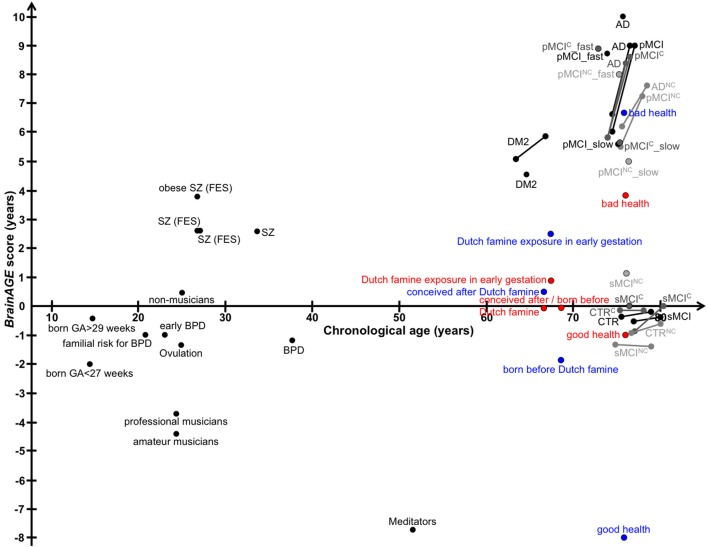
Figure 12.
Graphical summary of BrainAGE results in human studies. Dots, study means; Lines, longitudinal results; Blue, males; Red, females. [AD, Alzheimer's disease; BPD, bipolar disorder; CTR, control subjects; DM2, diabetes mellitus type 2; FES, first episode of schizophrenia-spectrum disorders; GA, gestational age; MCI, mild cognitive impairment; pMCI, progressive MCI (i.e., convert from MCI to AD during follow-up); pMCI_fast, diagnosis was MCI at baseline, conversion to AD within the first 12 months (without reversion to MCI or CTR at any available follow-up; pMCI_slow, diagnosis was MCI at baseline, conversion to AD was reported after the first 12 months of follow-up (without reversion to MCI or CTR at any available follow-up); sMCI, stable MCI (i.e., diagnosis is MCI at all available time points, but at least for 36 months); SZ, schizophrenia].

