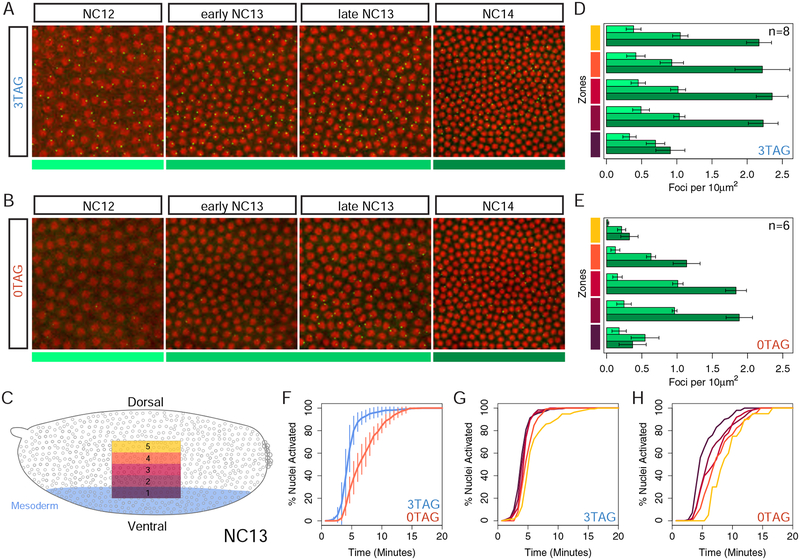
Figure 2: MS2 imaging reveals a position dependent transcriptional delay in the absence of Zld binding sites.
(A-B) Frames taken from live imaging Videos S1 and S2 that track transcription (green spots) from NC12 to NC14 as indicated and color coded below, NC12 (light green), NC13 (medium green), NC14 (dark green). Nuclei (red) have been labeled using maternally loaded H2Av-RFP. Bars on right side follow five zones along the dorsal/ventral axis with ventral mesoderm on bottom (Zone 1) as diagrammed in the embryo schematic (C) with blue shading defining the presumptive mesoderm of the embryo. (D-E) Quantification of the number of expressing nuclei in NC12 to NC14 (color coded as in A-B) agrees with conventional in situ analysis, showing markedly fewer active nuclei in 0TAG embryos across consecutive nuclear cycles, especially in Zones 4 and 5. In total, 8 3TAG embryos and 6 0TAG embryos were analyzed as indicated in the bar plots, and plotted with error bars representing one standard deviation of all values collected for each cycle and bin. For additional videos, see Videos S3–S6. (F-H) Cumulative distribution curves of nuclei that activate transcription in NC13, excluding nuclei that never activate in NC13. Time 0 on the X-axis is the start of anaphase of the previous cycle, NC12. All zones concatenated with delay values across genotypes in (F) with variance across biological replicates indicated with vertical lines showing one standard deviation of all embryos measured. 3TAG embryos activate transcription simultaneously across the expression domain (G), and 0TAG embryos show a delay dependent on the nucleus’ position in the Dl gradient (H).

