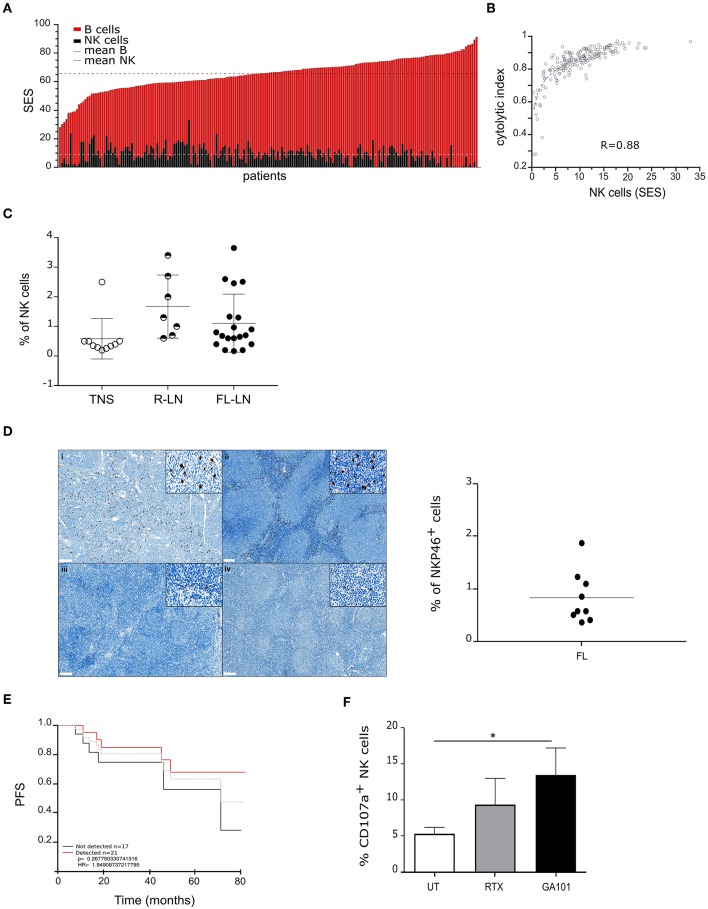
Figure 1.
Functional NK cells infiltrate follicular lymphoma lymh nodes. (A) Sample enrichment scores (SES) of NK and B cells in 169 FL patients. (B) Correlation of “NK cells” SES with expression levels of the cytolytic index. (C) Percent of NK cells in normal tonsil (TNS, n = 10), reactive (R-LN, n = 7) or FL lymph nodes (FL-LN, n = 19). NK cells were discriminated by CD56+/CD3− staining by flow cytometry. (D) Left panel, Representative sections from FL lymph node with a strong (i, ii) and weak (iii, iv) NKP46+ staining (brown). Magnification × 70 (insert, × 800). Right panel, Quantification of NK cells (%) in FFPE FL lymph nodes (n = 9). (E) Kaplan–Meier estimation of PFS of 169 FL patients according to NK cells detection in biopsies. The gray line represents the mean. (F) Autologous degranulation of NK cells in FL samples after treatment or not by RTX or GA101 at 10 μl/ml during 4 h. Histograms represent the mean ± sem of 6 independent FL samples. *p < 0.05 compared to untreated condition.

