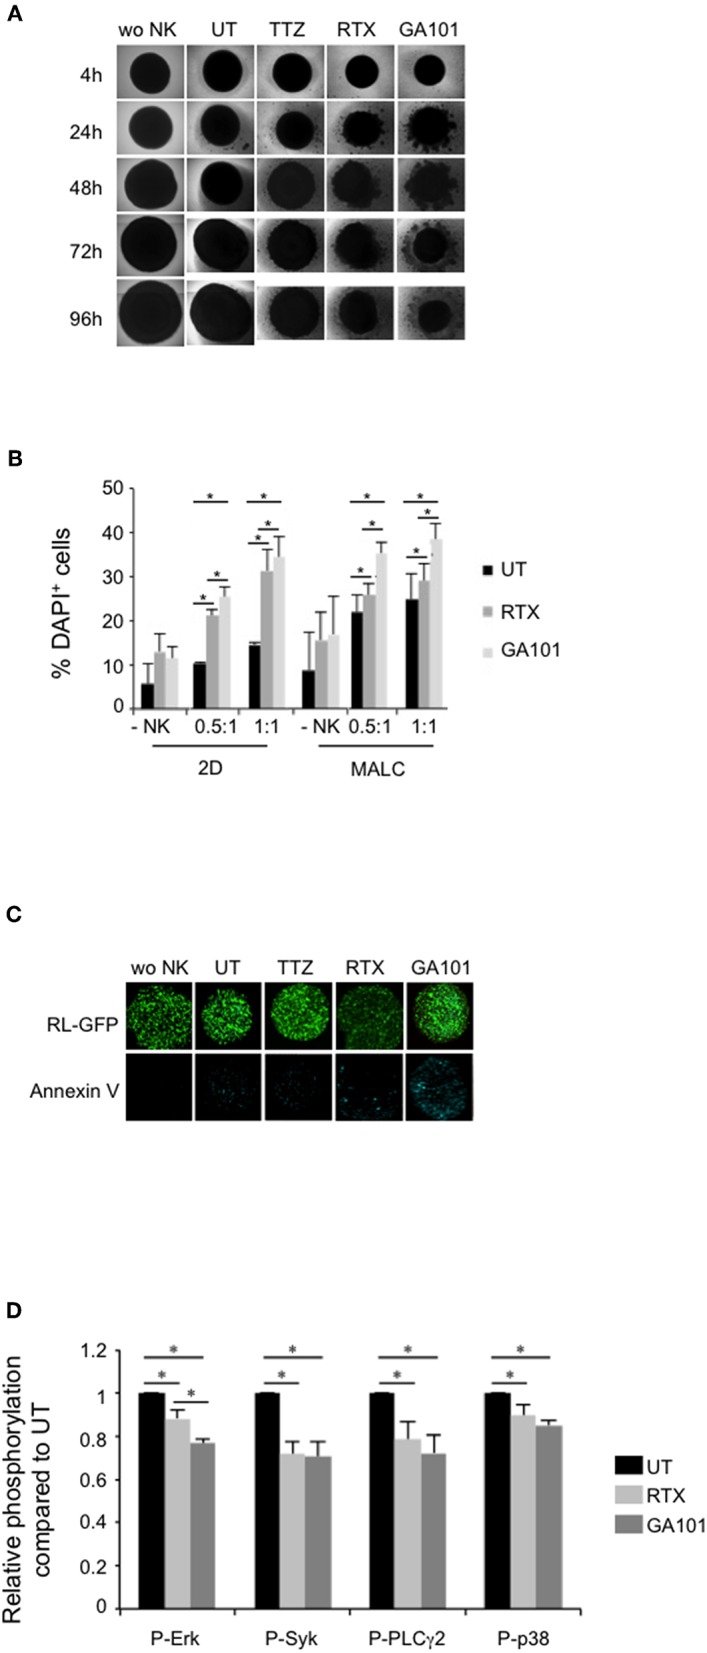
Figure 2.

MALC targeting by anti-CD20-induced activation of NK cells. (A) Visualization of MALC structure. MALC of RL cells at day 10 of culture were incubated or not (wo NK) with NK cells at ratio E:T 0.5:1 and treated or not (UT) by TTZ, RTX or GA101 at 10 μl/ml. MALC structure was observed after 4 to 96 h with an inverted Nikon Eclipse TE200 microscope at magnification ×40. Pictures are representative of five independent experiments. (B) Determination of target cell death by flow cytometry. MALC of RL cells at day 10 of culture were incubated or not (-NK) with NK cells at two different ratios E:T 0.5:1 and 1:1 and treated or not (UT) with mAbs at 10 μl/ml. After 4 h, target cell death was determined by flow cytometry using DAPI staining on CD19+ gated cells. Results are mean ± sem of five independent experiments. *p < 0.05 compared to UT condition or between anti-CD20 mAbs. (C) Visualization of target cell death. MALC of RL-GFP cells at day 10 of culture were incubated or not (wo NK) with NK cells at ratio E:T 10:1 and treated or not by TTZ, RTX or GA101 at 10 μl/ml. After 4 h, MALC cell death was visualized by Annexin V staining and observed with a confocal microscope. (D) Determination of phosphoflow in target cells. MALC of RL cells at day 10 of culture were co-cultured with NK cells at ratio E:T 0.5:1 and treated or not (UT) by RTX or GA101 at 10 μl/ml. After 4 h, signaling in CD19+ cells was investigated by flow cytometry. Results are mean ± sem of five independent experiments. *p < 0.05 compared to UT condition or between anti-CD20 mAbs.
