Figure 3.
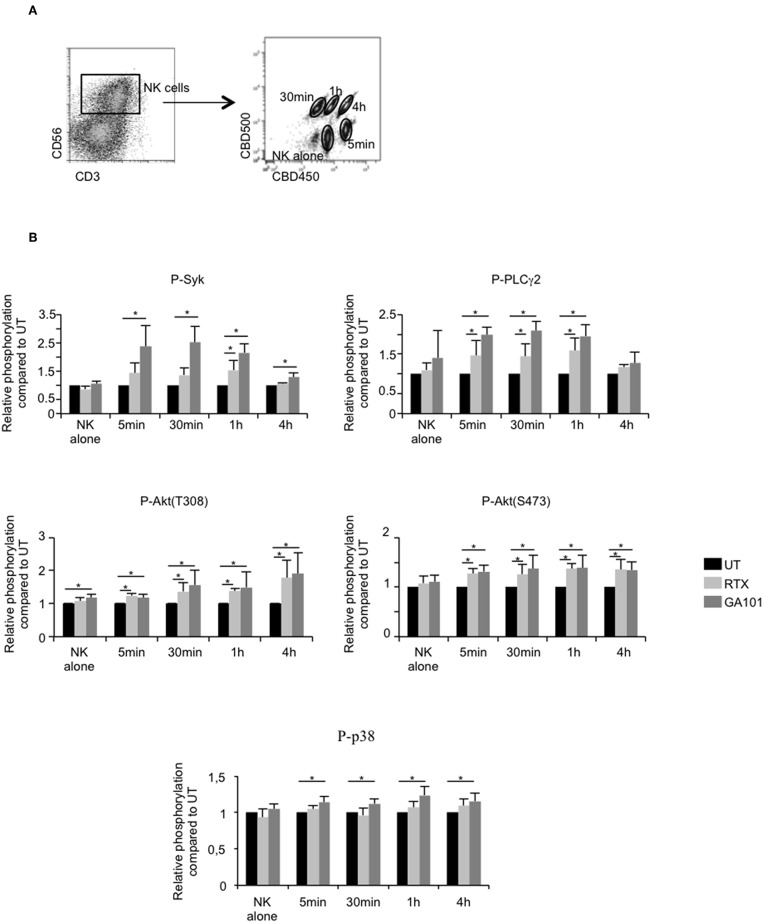
Downstream FcγRIIIa signaling in activated NK cells. MALC of RL cells at day 10 of culture were incubated or not with NK cells at ratio E:T 0.5:1 and treated or not (UT) with mAbs at 10 μl/ml. Five min, 30 min, 1 h, or 4 h after treatment, cells were barcoded individually with different concentrations of CBD dyes as described in methods and intracellular phosphoflow was analyzed. (A) Representative cytogram. Example of 5 different samples deconvoluted after fluorescent barcoding with different concentrations of CBD450 and CBD500. (B) FcγRIIIA intracellular signaling. Phosphorylation status of Syk, PLCγ2, AKT, and p38 was determined by flow cytometry on NK cells. Histograms represent the ratio of MFI of treated compared to UT conditions. Results are mean ± sem of five independent experiments. *p < 0.05.

