Figure 2.
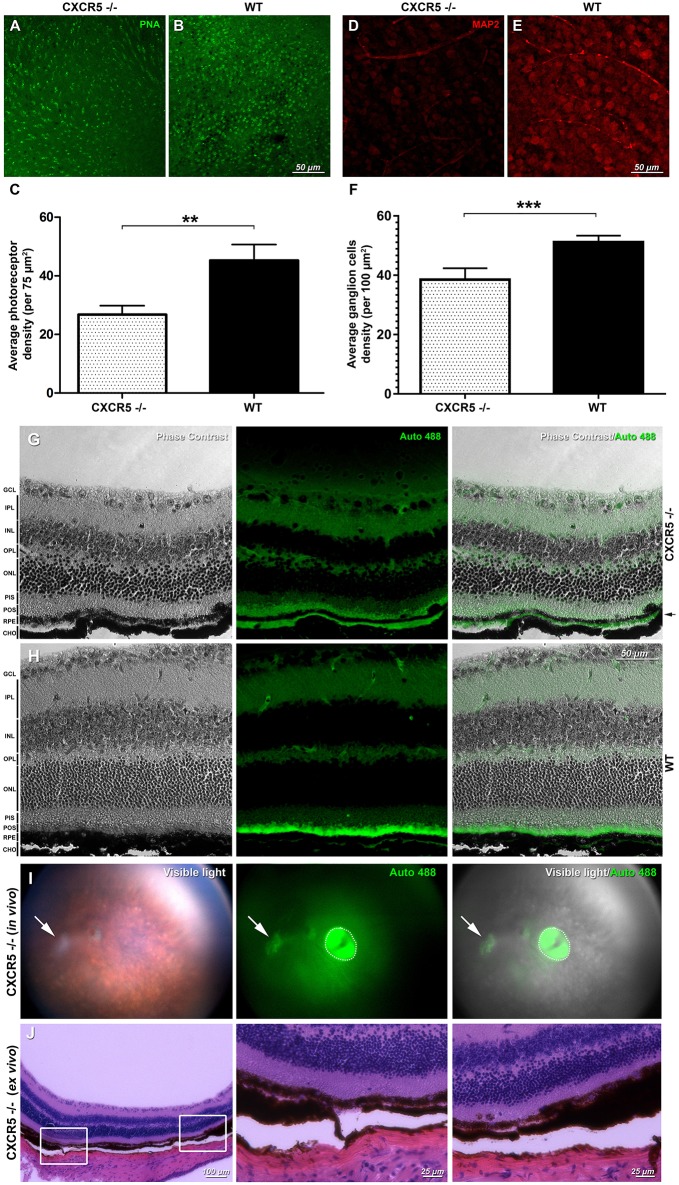
Retinal flat mounts evaluation and detection of autofluorescence and signs of geographic atrophy (GA) in aged CXCR5−/− animals. Peanut lectin staining (PNA) of (A) CXCR5−/− retinas demonstrated markedly reduced numbers of photoreceptors relative to the (B) WT retinas; PNA staining results are further confirmed by (C) quantitative analysis (n = 5) of the photoreceptors cells density; (D) MAP2 microtubule-associated protein 2 (MAP-2) immunostaining of CXCR5−/− ganglion cells indicating marked reduction of the MAP-2 fluorescent signaling and number of ganglion cells when compared with the (E) WT controls; and consistent with (F) quantification of ganglion cells number (n = 5) that indicate significant reduction relative to the WT retinas. A student's t-test was used to determine statistical significance. **p < 0.01; ***p < 0.001. Phase contrast and autofluorescence images of the (G) CXCR5−/− and (H) WT controls eye sections. Autofluorescent signal was detected in the sub-RPE space of 24 m.o. CXCR5−/− mice and was visible as a second green layer separated by a black RPE layer from autofluorescent photoreceptors (indicated by black arrow). A marked reduction in the autofluorescence of the photoreceptor layer was also observed in aged CXCR5−/− eyes. The minimal sub-RPE autofluorescent deposition was observed in age-matched WT controls. Retinal layer designations: GCL, ganglion cell layer; IPL, inner plexiform layer; INL, inner nuclear layer; OPL, outer plexiform layer; ONL, outer nuclear layer; PIS, photoreceptors inner segments; POS, photoreceptors outer segments; RPE, retinal pigment epithelia; CHO, choroid. All the samples were obtained from 24 m.o. female mice. Detection of autofluorescence in the eyes of 24 m.o. CXCR5−/− mouse (I) the white arrow indicates the area of the atrophy, and the dotted circle indicates a reflection artifact. (J) Histological findings in the atrophied area of the same CXCR5−/− animal demonstrating the RPE thinning and reduced density of the ganglion cells. Enlarged portions of the image demonstrate the beginning the end of the atrophic spot.

