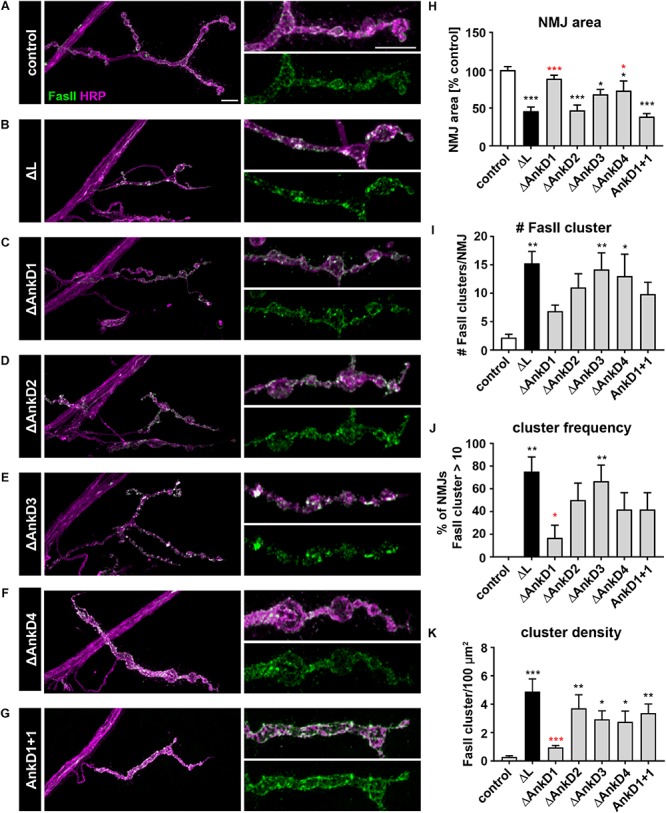
FIGURE 6.

Analysis of ARD-dependent control of synaptic CAM organization. (A–G) Analysis of the synaptic distribution of the CAM Fas II (green) at type Ib muscle 4 NMJs marked by HRP (magenta). In contrast to control animals (P[ank2_wt]/+; ank2ΔL/ank2null) (A) absence of Ank2-L (B) or deletions/manipulations of the AnkDs (C–G) result in severe perturbations of the organization of the peri-active zone associated NCAM homolog Fas II. (H–K) Quantification of NMJ area (H), number of Fas II cluster per NMJ (I), frequency of NMJs displaying more than 10 Fas II cluster (J) and Fas II cluster density per 100 μm2 (K) (n = 12 muscle 4 NMJs, three animals). Scale bars in (A) apply to (A–G) and represent 10 μm. Error bars indicate SEM; *p < 0.05, ∗∗p < 0.01, ∗∗∗p < 0.001 (ANOVA); black asterisks represent comparisons to controls; red asterisks represent comparisons to ank2ΔL mutants.
