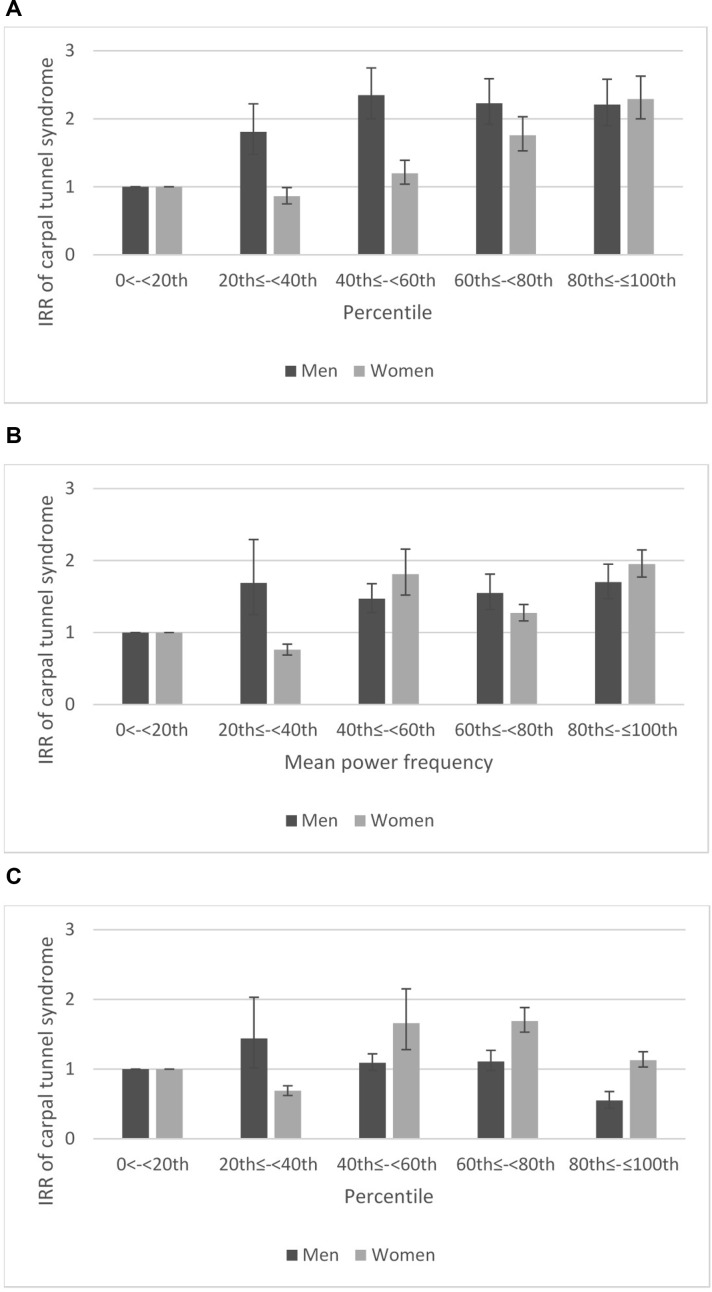
Figure 2.
The association between angular velocity (A), mean power frequency (B) and range of motion (C) and carpal tunnel syndrome stratified by sex. Exposure ranges in percentiles as in table 3. Estimates are adjusted incidence rate ratios (IRRs), including marks reflecting the CIs. Adjustments are similar to adjustments described in table 3.

