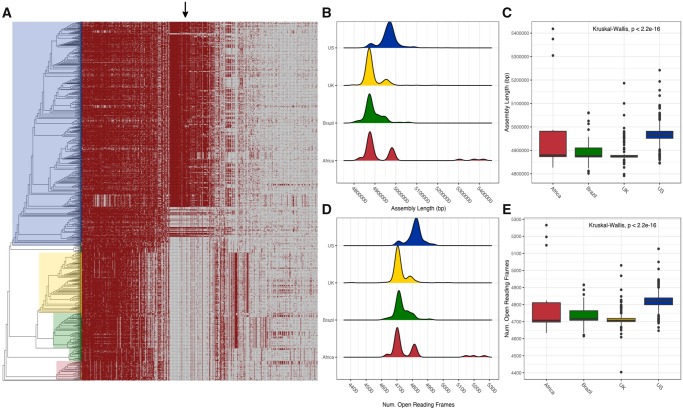
Fig. 4.
—Pangenome of S. Dublin. (A) Presence–absence matrix of the pangenome plotted against the phylogeny of S. Dublin. Note that core genes and genes with a prevalence of <5% were removed to enhance clarity. The arrow denotes a block of genes linked with the IncA/C2 plasmid replicon. (B, C) Density and bar plots of assembly length plotted according to the region of isolation. US genomes are ∼100 kb longer than genomes from other regions. (D, E) US genomes contain ∼100 more open reading frames than genomes from other regions. Density plots are colored respective to region of isolation consistent with figures 2 and 3.

