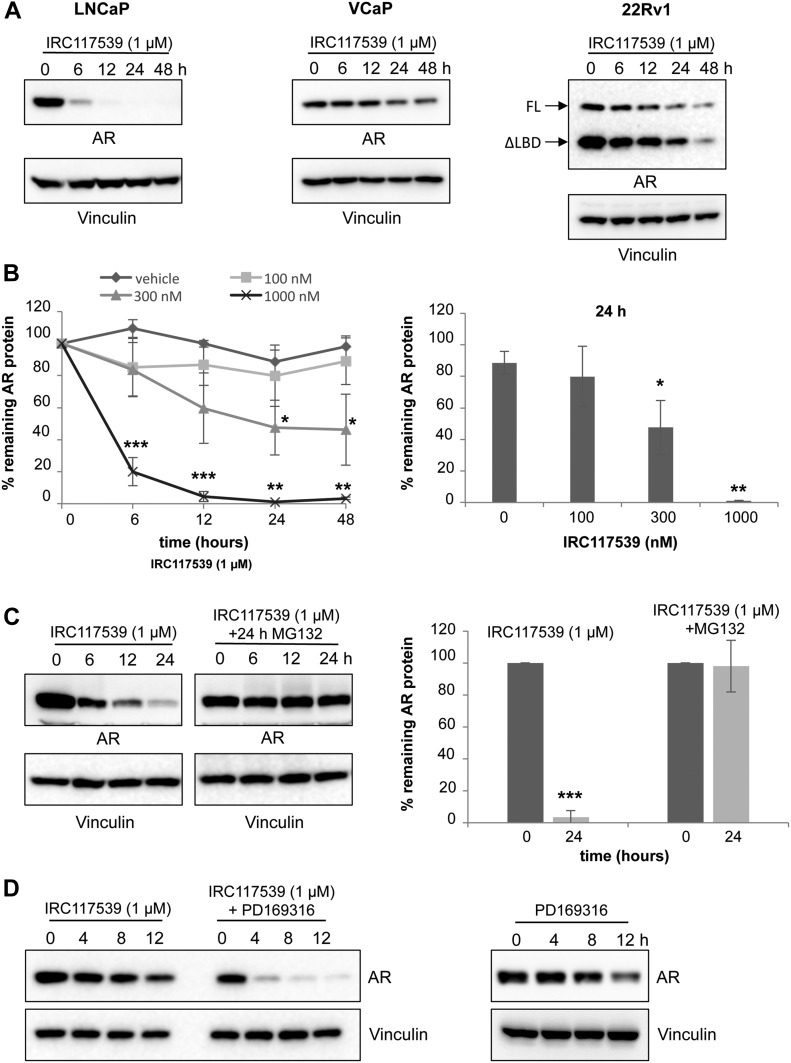
Figure 2. IRC117539 induces AR protein degradation by the proteasome.
(A) Western blot analysis of AR protein levels in LNCaP, VCaP, and 22Rv1 prostate cancer cells treated with 1 μM IRC117539 compound for indicated times. Note two different AR isoforms (FL, full-length retaining LBD; ΔLBD, the truncated variant) in 22Rv1 cells, which are both degraded. (B) Dose-dependent kinetics of IRC117539-induced AR degradation in LNCaP cells (left panel). AR protein levels were quantified after Western blot and normalized to vinculin (n = 3, representative blots are shown in Figs 2A and S2B). A dose–response graphic for the 24-h time point is shown in the right panel. (C) Proteasome-dependent degradation of AR. Western blot (left) shows AR protein levels in LNCaP cells exposed to 1 μM IRC117539, with or without proteasome inhibition. Right panel shows quantification of AR protein levels at 24 h (n = 3). (D) Western blot analysis of AR protein levels in LNCaP cells co-treated with 10 μM PD169316, a small molecule proteasome activator. Note accelerated kinetics of IRC117539-induced AR degradation. Data information: in (B and C), data are presented as mean ± SEM (n = 3). Asterisks denote statistical significance (*P < 0.05, **P < 0.01, ***P < 0.001, using t test assuming unequal variances).

