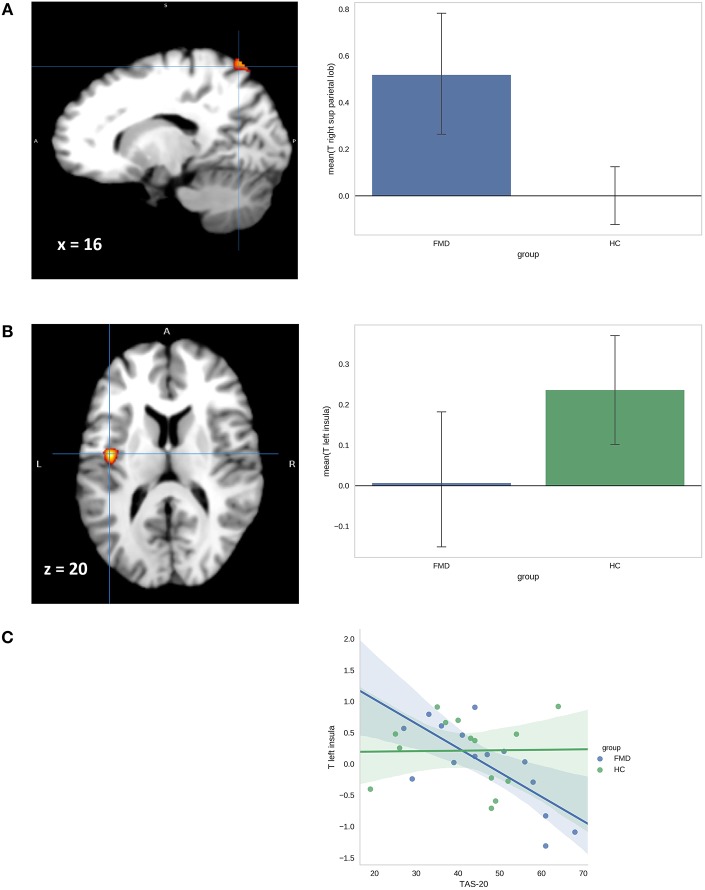
Figure 2.
(A) Activation map and adjacent barplot demonstrate group differences in activation of the left superior parietal lobus in the negative-regulate>negative look contrast. (B) Activation map and adjacent bar-plot shows group differences in the left insula activation in the contrast negative-look>neutral-look. (C) Scatterplot shows the relationship between t-values for the negative-look>neutral-look contrast in left insula and TAS-20 scores for FMD patients and HCs.

